
Page 195 - Global Tectonics
P. 195
CONTINENTAL RIFTS AND RIFTED MARGINS 181
After this time the weakest areas are found on both sides the forces driving extension. The opposing force makes
of the central rift basin. This model shows how the it more difficult to continue deforming in the same
strong dependence of lithospheric strength on temper- locality, resulting in a delocalization of strain as the
ature causes strain delocalization and the formation of deformation migrates into areas that are more easily
wide rifts composed of multiple rift basins at slow strain deformable (Buck, 1991).
rates. The model predicts that continental break-up will Several processes may either reduce or enhance the
not occur for sufficiently slow rift velocities. effects of crustal buoyancy forces during lithospheric
stretching. Buck (1991) and Hopper & Buck (1996)
showed that where the crust is initially thin and cool,
7.6.3 Buoyancy forces and and the mantle lithosphere is relatively thick, the overall
strength (the effective viscosity) of the lithosphere
lower crustal flow remains relatively high under conditions of constant
strain rate (Fig. 7.24a). In this case, the effects of crustal
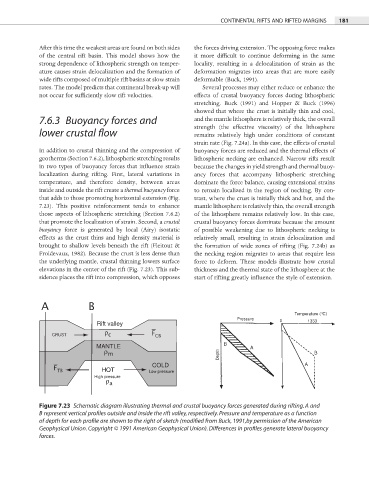
In addition to crustal thinning and the compression of buoyancy forces are reduced and the thermal effects of
geotherms (Section 7.6.2), lithospheric stretching results lithospheric necking are enhanced. Narrow rifts result
in two types of buoyancy forces that infl uence strain because the changes in yield strength and thermal buoy-
localization during rifting. First, lateral variations in ancy forces that accompany lithospheric stretching
temperature, and therefore density, between areas dominate the force balance, causing extensional strains
inside and outside the rift create a thermal buoyancy force to remain localized in the region of necking. By con-
that adds to those promoting horizontal extension (Fig. trast, where the crust is initially thick and hot, and the
7.23). This positive reinforcement tends to enhance mantle lithosphere is relatively thin, the overall strength
those aspects of lithospheric stretching (Section 7.6.2) of the lithosphere remains relatively low. In this case,
that promote the localization of strain. Second, a crustal crustal buoyancy forces dominate because the amount
buoyancy force is generated by local (Airy) isostatic of possible weakening due to lithospheric necking is
effects as the crust thins and high density material is relatively small, resulting in strain delocalization and
brought to shallow levels beneath the rift (Fleitout & the formation of wide zones of rifting (Fig. 7.24b) as
Froidevaux, 1982). Because the crust is less dense than the necking region migrates to areas that require less
the underlying mantle, crustal thinning lowers surface force to deform. These models illustrate how crustal
elevations in the center of the rift (Fig. 7.23). This sub- thickness and the thermal state of the lithosphere at the
sidence places the rift into compression, which opposes start of rifting greatly infl uence the style of extension.
A B
Temperature (°C)
Pressure 0 1333
Rift valley
ρ
CRUST c F CB
B
MANTLE A
ρ m Depth B
F HOT COLD A
TB Low pressure
High pressure
ρ a
Figure 7.23 Schematic diagram illustrating thermal and crustal buoyancy forces generated during rifting. A and
B represent vertical profiles outside and inside the rift valley, respectively. Pressure and temperature as a function
of depth for each profile are shown to the right of sketch (modified from Buck, 1991,by permission of the American
Geophysical Union. Copyright © 1991 American Geophysical Union). Differences in profiles generate lateral buoyancy
forces.