
Page 256 - Global Tectonics
P. 256
242 CHAPTER 8
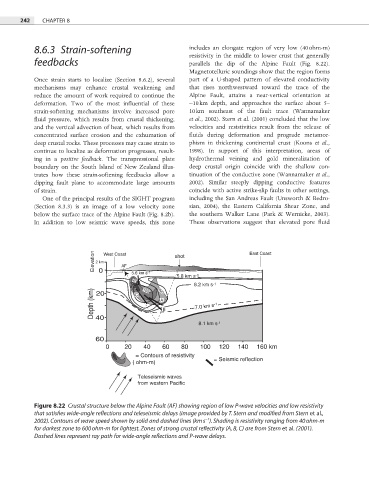
8.6.3 Strain-softening includes an elongate region of very low (40 ohm-m)
resistivity in the middle to lower crust that generally
feedbacks parallels the dip of the Alpine Fault (Fig. 8.22).
Magnetotelluric soundings show that the region forms
Once strain starts to localize (Section 8.6.2), several part of a U-shaped pattern of elevated conductivity
mechanisms may enhance crustal weakening and that rises northwestward toward the trace of the
reduce the amount of work required to continue the Alpine Fault, attains a near-vertical orientation at
deformation. Two of the most influential of these ∼10 km depth, and approaches the surface about 5–
strain-softening mechanisms involve increased pore 10 km southeast of the fault trace (Wannamaker
fluid pressure, which results from crustal thickening, et al., 2002). Stern et al. (2001) concluded that the low
and the vertical advection of heat, which results from velocities and resistivities result from the release of
concentrated surface erosion and the exhumation of fluids during deformation and prograde metamor-
deep crustal rocks. These processes may cause strain to phism in thickening continental crust (Koons et al.,
continue to localize as deformation progresses, result- 1998). In support of this interpretation, areas of
ing in a positive feedback. The transpressional plate hydrothermal veining and gold mineralization of
boundary on the South Island of New Zealand illus- deep crustal origin coincide with the shallow con-
trates how these strain-softening feedbacks allow a tinuation of the conductive zone (Wannamaker et al.,
dipping fault plane to accommodate large amounts 2002). Similar steeply dipping conductive features
of strain. coincide with active strike-slip faults in other settings,
One of the principal results of the SIGHT program including the San Andreas Fault (Unsworth & Bedro-
(Section 8.3.3) is an image of a low velocity zone sian, 2004), the Eastern California Shear Zone, and
below the surface trace of the Alpine Fault (Fig. 8.2b). the southern Walker Lane (Park & Wernicke, 2003).
In addition to low seismic wave speeds, this zone These observations suggest that elevated pore fl uid
Elevation 2 km West Coast shot East Coast
0
5.6 km s -1
5.8 km s -1
40
6.2 km s -1
Depth (km) 7.0 km s -1
20
100
600
40
8.1 km s -1
60
0 20 40 60 80 100 120 140 160 km
= Contours of resistivity
( ohm-m) = Seismic reflection
Teleseismic waves
from western Pacific
Figure 8.22 Crustal structure below the Alpine Fault (AF) showing region of low P-wave velocities and low resistivity
that satisfies wide-angle reflections and teleseismic delays (image provided by T. Stern and modified from Stern et al.,
−1
2002). Contours of wave speed shown by solid and dashed lines (km s ). Shading is resistivity ranging from 40 ohm-m
for darkest zone to 600 ohm-m for lightest. Zones of strong crustal reflectivity (A, B, C) are from Stern et al. (2001).
Dashed lines represent ray path for wide-angle reflections and P-wave delays.