Page 254 - Global Tectonics
P. 254

240   CHAPTER 8


                                      X 3                          X 3                          X 3
              (a)                           (b)                         (c)


              0                            0                           0
                Upper crust                  Upper crust                 Upper crust
              20                Lower crust   20            Lower crust   20             Lower crust
                   600 C                  40   600 C                   40   600 C
            Depth, km   60     900 C     Depth, km   60     900 C    Depth, km   60  Mantle  900 C
              40
              80   Mantle                 80  Mantle                   80
                   1200                              1200 C
                                                                           1200 C
             100                         100                          100
               100     50      0            100    50      0            100     50      0
                       Distance, km                 Distance, km                Distance, km
              1                            1                           1
            Strength  0.8                Strength  0.8               Strength  0.8
             0.6
                                          0.6
                                                                      0.6
               100     50     0      50     100    50     0      50     100     50     0      50
                       Distance, km                 Distance, km                Distance, km
            Time: 0.2 Myr               Time: 0.2 Myr                Time: 2.0 Myr
              0                            0                           0
              20                          20                           20
            Depth, km   40               Depth, km   40              Depth, km   40
                                                                       60
              60
                                          60
              80                          80                           80
             100                         100                          100
               100     50     0             100    50      0            100     50     0
                       Distance, km                 Distance, km               Distance, km
            Time: 2.6 Myr               Time: 2.6 Myr                Time: 4.0 Myr
              0                            0                           0
              20                          20                           20
            Depth, km   40               Depth, km   40              Depth, km   40
                                          60
                                                                       60
              60
              80                          80                           80
             100                         100                          100
               100     50     0             100    50      0            100     50     0
                       Distance, km                 Distance, km                Distance, km
               Log (strain rate)
                16   15   14   13
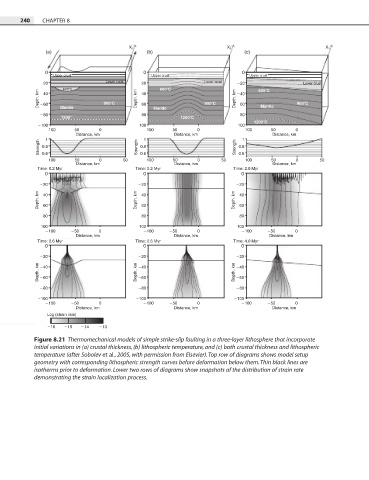
           Figure 8.21  Thermomechanical models of simple strike-slip faulting in a three-layer lithosphere that incorporate
           initial variations in (a) crustal thickness, (b) lithospheric temperature, and (c) both crustal thickness and lithospheric
           temperature (after Sobolev et al., 2005, with permission from Elsevier). Top row of diagrams shows model setup
           geometry with corresponding lithospheric strength curves before deformation below them. Thin black lines are
           isotherms prior to deformation. Lower two rows of diagrams show snapshots of the distribution of strain rate
           demonstrating the strain localization process.
   249   250   251   252   253   254   255   256   257   258   259