
Page 249 - Global Tectonics
P. 249
CONTINENTAL TRANSFORMS AND STRIKE-SLIP FAULTS 235
(a) (b)
39.5°N COAST
39.0°N GREAT VALLEY
profile, Fig. 8.18c
38.5°N Great Valley -
Sierra Nevada 38°N
38.0°N microplate
CF
37.5°N HF
GF
37.0°N PACIFIC OCEAN
36.5°N
km SAF
Pacific Plate RANGES
36.0°N 0 50
37°N Scale:
35.5°N 40 mm a -1
124°W 123°W 122°W 121°W 120°W
123°W 122°W
(c) 50
45
40
Velocities parallel to the
35
San Andreas Fault (~N34°W)
30
25
Velocity (mm a -1 ) 20
15
10
5
San Andreas Fault (~N56°E)
-5 0 Velocities transverse to the
- 10
- 15
Coast Ranges Great Valley Sierra Nevada
- 20
- 50 0 50 100 150 200 250 300
Distance NE from the San Andreas Fault
along a Great Circle (km)
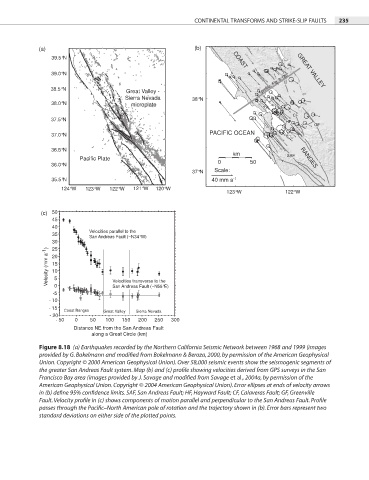
Figure 8.18 (a) Earthquakes recorded by the Northern California Seismic Network between 1968 and 1999 (images
provided by G. Bokelmann and modified from Bokelmann & Beroza, 2000, by permission of the American Geophysical
Union. Copyright © 2000 American Geophysical Union). Over 58,000 seismic events show the seismogenic segments of
the greater San Andreas Fault system. Map (b) and (c) profile showing velocities derived from GPS surveys in the San
Francisco Bay area (images provided by J. Savage and modified from Savage et al., 2004a, by permission of the
American Geophysical Union. Copyright © 2004 American Geophysical Union). Error ellipses at ends of velocity arrows
in (b) define 95% confidence limits. SAF, San Andreas Fault; HF, Hayward Fault; CF, Calaveras Fault; GF, Greenville
Fault. Velocity profile in (c) shows components of motion parallel and perpendicular to the San Andreas Fault. Profile
passes through the Pacific–North American pole of rotation and the trajectory shown in (b). Error bars represent two
standard deviations on either side of the plotted points.