
Page 251 - Global Tectonics
P. 251
CONTINENTAL TRANSFORMS AND STRIKE-SLIP FAULTS 237
120 W 119 W 118 W 117 W 116 W 120 W 119 W 118 W 117 W 116 W
(a) (b)
CNSB
40 N 40 N 40 N 40 N
39 N 39 N 39 N 39 N
WL
CGB I
38 N SN 38 N 38 N 38 N
III
II
37 N 25 km 37 N 37 N 37 N
M>6
4<M<6 ECSZ 25 km
M<4
10 mm a -1
20 mm a -1
120 W 119 W 118 W 117 W 116 W 120 W 119 W 118 W 117 W 116 W
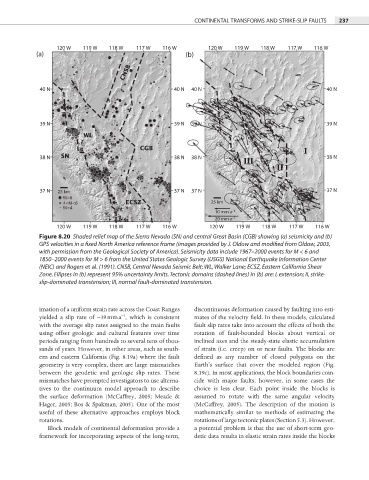
Figure 8.20 Shaded relief map of the Sierra Nevada (SN) and central Great Basin (CGB) showing (a) seismicity and (b)
GPS velocities in a fixed North America reference frame (images provided by J. Oldow and modified from Oldow, 2003,
with permission from the Geological Society of America). Seismicity data include 1967–2000 events for M < 6 and
1850–2000 events for M > 6 from the United States Geologic Survey (USGS) National Earthquake Information Center
(NEIC) and Rogers et al. (1991). CNSB, Central Nevada Seismic Belt; WL, Walker Lane; ECSZ, Eastern California Shear
Zone. Ellipses in (b) represent 95% uncertainty limits. Tectonic domains (dashed lines) in (b) are: I, extension; II, strike-
slip-dominated transtension; III, normal fault-dominated transtension.
imation of a uniform strain rate across the Coast Ranges discontinuous deformation caused by faulting into esti-
−1
yielded a slip rate of ∼39 mm a , which is consistent mates of the velocity field. In these models, calculated
with the average slip rates assigned to the main faults fault slip rates take into account the effects of both the
using offset geologic and cultural features over time rotation of fault-bounded blocks about vertical or
periods ranging from hundreds to several tens of thou- inclined axes and the steady-state elastic accumulation
sands of years. However, in other areas, such as south- of strain (i.e. creep) on or near faults. The blocks are
ern and eastern California (Fig. 8.19a) where the fault defined as any number of closed polygons on the
geometry is very complex, there are large mismatches Earth’s surface that cover the modeled region (Fig.
between the geodetic and geologic slip rates. These 8.19c). In most applications, the block boundaries coin-
mismatches have prompted investigators to use alterna- cide with major faults; however, in some cases the
tives to the continuum model approach to describe choice is less clear. Each point inside the blocks is
the surface deformation (McCaffrey, 2005; Meade & assumed to rotate with the same angular velocity
Hager, 2005; Bos & Spakman, 2005). One of the most (McCaffrey, 2005). The description of the motion is
useful of these alternative approaches employs block mathematically similar to methods of estimating the
rotations. rotations of large tectonic plates (Section 5.3). However,
Block models of continental deformation provide a a potential problem is that the use of short-term geo-
framework for incorporating aspects of the long-term, detic data results in elastic strain rates inside the blocks