
Page 334 - Global Tectonics
P. 334
OROGENIC BELTS 317
28°N 30°N 32°N 34°N 36°N
INDEPTH
Qiangtang Songpan-Ganz i Qaidam
terrane terrane basin
Greater Himalaya
Lesser Himalaya
Tethyan
MBT STDS Himalaya suture Indus - Lhasa terrane Banggong suture fault
Jinsha
suture
MCT LHSA SANG AMDO WNDO ERDO BUDO TUNL
N. Kunlun
Zangbo
S N
MHT
Indian crust 40
Moho
Lower crust 80
Moho Inefficient S n - low P n - zone
Asian 120
Indian mantle Anisotropy developed by continental
lithosphere
lithosphere lateral flow 160
200
Tet
240
Low S-wave zone
Tethyan
oceanic
lithosphere
V p = 6.3 - 7.5 km s -1 ?
V p = 7.2 - 7.5 km s -1 200 km
Lower crust
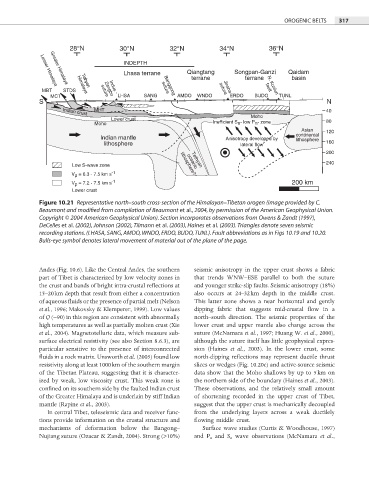
Figure 10.21 Representative north–south cross-section of the Himalayan–Tibetan orogen (image provided by C.
Beaumont and modified from compilation of Beaumont et al., 2004, by permission of the American Geophysical Union.
Copyright © 2004 American Geophysical Union). Section incorporates observations from Owens & Zandt (1997),
DeCelles et al. (2002), Johnson (2002), Tilmann et al. (2003), Haines et al. (2003). Triangles denote seven seismic
recording stations. (LHASA, SANG, AMDO, WNDO, ERDO, BUDO, TUNL). Fault abbreviations as in Figs 10.19 and 10.20.
Bulls-eye symbol denotes lateral movement of material out of the plane of the page.
Andes (Fig. 10.6). Like the Central Andes, the southern seismic anisotropy in the upper crust shows a fabric
part of Tibet is characterized by low velocity zones in that trends WNW–ESE parallel to both the suture
the crust and bands of bright intra-crustal refl ections at and younger strike-slip faults. Seismic anisotropy (18%)
15–20 km depth that result from either a concentration also occurs at 24–32 km depth in the middle crust.
of aqueous fluids or the presence of partial melt (Nelson This latter zone shows a near horizontal and gently
et al., 1996; Makovsky & Klemperer, 1999). Low values dipping fabric that suggests mid-crustal flow in a
of Q (∼90) in this region are consistent with abnormally north–south direction. The seismic properties of the
high temperatures as well as partially molten crust (Xie lower crust and upper mantle also change across the
et al., 2004). Magnetotelluric data, which measure sub- suture (McNamara et al., 1997; Huang W. et al., 2000),
surface electrical resistivity (see also Section 8.6.3), are although the suture itself has little geophysical expres-
particular sensitive to the presence of interconnected sion (Haines et al., 2003). In the lower crust, some
fluids in a rock matrix. Unsworth et al. (2005) found low north-dipping reflections may represent ductile thrust
resistivity along at least 1000 km of the southern margin slices or wedges (Fig. 10.20c) and active-source seismic
of the Tibetan Plateau, suggesting that it is character- data show that the Moho shallows by up to 5 km on
ized by weak, low viscosity crust. This weak zone is the northern side of the boundary (Haines et al., 2003).
confined on its southern side by the faulted Indian crust These observations, and the relatively small amount
of the Greater Himalaya and is underlain by stiff Indian of shortening recorded in the upper crust of Tibet,
mantle (Rapine et al., 2003). suggest that the upper crust is mechanically decoupled
In central Tibet, teleseismic data and receiver func- from the underlying layers across a weak ductilely
tions provide information on the crustal structure and flowing middle crust.
mechanisms of deformation below the Bangong– Surface wave studies (Curtis & Woodhouse, 1997)
Nujiang suture (Ozacar & Zandt, 2004). Strong (>10%) and P n and S n wave observations (McNamara et al.,