Page 342 - Global Tectonics
P. 342

(b)         Log of viscosity (Pa s)
                   (a)                                                 21            22           23            24
                                       V N                          0
                                                       V
                                                        2
                    V                                               20
                     N  Tarim Basi n  Tibetan Plateau
                                                        V 3        Depth (km)  40

                   or   Indian Plate                                            Asian Continent
                                                Main Boundary       60
                          V                         Thrust
                           1
                                                                        Tibetan Plateau  Indian Plate
                                                                    80
                 (c)  70 o   75 o   80 o   85 o   90 o   95 o   100 o  105 o  110 o


                                                                                    o
                 40 o                                                             40 N


                 35 o                                                             35 N
                                                                                    o


                                                                                    o
                 30 o                                                             30 N


                                                                                    o
                 25 o                                                             25 N
                        25 MPa
                                                    o
                              o
                                      o
                                             o
                                                                                o
                     70 E   75 E    80 E   85 E   90 E   95 E  100 E  105 E   110 E
                                                                  o
                                                                         o
                       o
                                                           o
                                   Himalaya     Tibet            Tarim
                  (d)       India
                         0
                         10
                         20
                        Depth (km  40  MBT
                        )  30
                         70                                 30 MPa


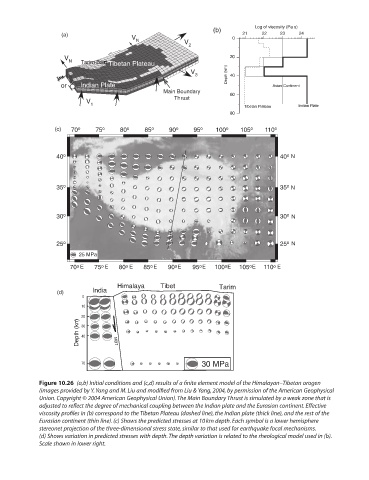
            Figure 10.26  (a,b) Initial conditions and (c,d) results of a finite element model of the Himalayan–Tibetan orogen

            (images provided by Y. Yang and M. Liu and modified from Liu & Yang, 2004, by permission of the American Geophysical

            Union. Copyright © 2004 American Geophysical Union). The Main Boundary Thrust is simulated by a weak zone that is
            adjusted to reflect the degree of mechanical coupling between the Indian plate and the Eurasian continent. Effective

            viscosity profiles in (b) correspond to the Tibetan Plateau (dashed line), the Indian plate (thick line), and the rest of the

            Eurasian continent (thin line). (c) Shows the predicted stresses at 10 km depth. Each symbol is a lower hemisphere
            stereonet projection of the three-dimensional stress state, similar to that used for earthquake focal mechanisms.
            (d) Shows variation in predicted stresses with depth. The depth variation is related to the rheological model used in (b).
            Scale shown in lower right.
   337   338   339   340   341   342   343   344   345   346   347