Page 346 - Global Tectonics
P. 346

(a) Crust and marker grid
                        600 km  India  Suture  Eurasia                    1400 km
                        -1            0          1           2
                       0                    UC
                      km  25                   LC
                      35
                         V P = 20 mm a  1  S
                      (b)                         .
                        Temperature and velocity  Denudation rate e = slope x f(t) x g(x)   T s  = 0  q s  = 71.25 mW m –2
                       0
                      km  25          S     A 1  A2
                      35                  θ                    Moho = 704 o C
                        V P   = 20 mm a  1           Initial conductive steady-state  Retro-mantle
                                                                       Lithosphere
                         Pro-mantle
                         Lithosphere                                q m  = 20 mW m -2
                       0     km     200                 Kinematic subduction
                           V:H = 1:1                 V P  = 20 mm a -1


                      (c) t = 30 Myr    Δx = 1500 km  Erosion front  Current rate of erosion
                      Deformation  10 mm a  1                     –2    –1      Suture
                                                                                 0
                              –7             –6    –5  –4   –3

                      V  = 50 mm a  1                                              S
                      P
                     Velocity, temperature and radioactive heat sources    V  = 25 mm a –1
                                                                            S
                                                                   A   = 2.0 μW m  –3
                                                                    1
                                          o
                                        700 C                                 A  = 0.75 μW  m –3
                                               o
                      V P  = 50 mm a  1     800 C                              2
                      (d) t = 39 Myr    Δx = 1950 km                                  Moho
                          10 mm a  1                                          S (Δx = 750 km)
                                –8     –7     –3   –2    –1        0            1


                                                      o
                                                    700 C
                                                             o
                                                           800 C
                      (e) t = 48 Myr    Δx = 2400 km                          S (Δx = 975 km)
                    10 mm a  1
                               –9      –2    –1        0            1              2


                                         o
                                       700 C
                                                o
                                              800 C
                      0      km      200                                     S (Δx = 1200 km)
                           V:H = 1:1
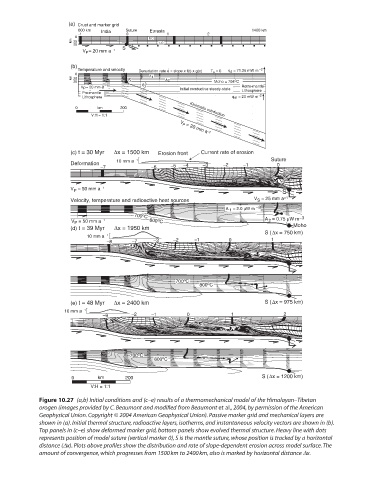
            Figure 10.27  (a,b) Initial conditions and (c–e) results of a thermomechanical model of the Himalayan–Tibetan
            orogen (images provided by C. Beaumont and modified from Beaumont et al., 2004, by permission of the American

            Geophysical Union. Copyright © 2004 American Geophysical Union). Passive marker grid and mechanical layers are
            shown in (a). Initial thermal structure, radioactive layers, isotherms, and instantaneous velocity vectors are shown in (b).
            Top panels in (c–e) show deformed marker grid, bottom panels show evolved thermal structure. Heavy line with dots
            represents position of model suture (vertical marker 0), S is the mantle suture, whose position is tracked by a horizontal
            distance (Dx). Plots above profiles show the distribution and rate of slope-dependent erosion across model surface. The

            amount of convergence, which progresses from 1500 km to 2400 km, also is marked by horizontal distance Dx.
   341   342   343   344   345   346   347   348   349   350   351