
Page 123 - Glucose Monitoring Devices
P. 123
124 CHAPTER 6 CGM sensor technology
Main Menu Icon SG Status Bar
Temp Profile Active STx ID/SN, STx connection to sensor, STx battery
Trend Arrow
Current SG reading
Unit of measure
Date & Time of Trend Graph View
Multiple Events
High Glucose Alert (top red line)
High Glucose Target Level (top green line)
Event (Exercise)
Low Glucose Target Level (bottom green line)
Calibration
Low Glucose Alert (bottom red line)
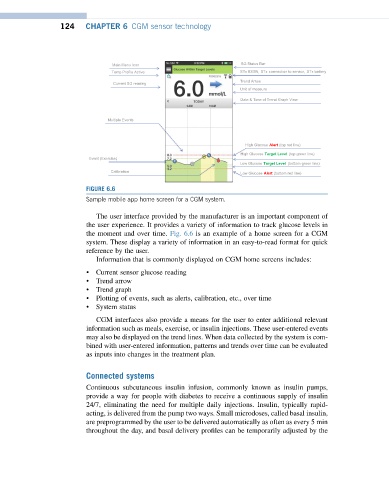
FIGURE 6.6
Sample mobile app home screen for a CGM system.
The user interface provided by the manufacturer is an important component of
the user experience. It provides a variety of information to track glucose levels in
the moment and over time. Fig. 6.6 is an example of a home screen for a CGM
system. These display a variety of information in an easy-to-read format for quick
reference by the user.
Information that is commonly displayed on CGM home screens includes:
• Current sensor glucose reading
• Trend arrow
• Trend graph
• Plotting of events, such as alerts, calibration, etc., over time
• System status
CGM interfaces also provide a means for the user to enter additional relevant
information such as meals, exercise, or insulin injections. These user-entered events
may also be displayed on the trend lines. When data collected by the system is com-
bined with user-entered information, patterns and trends over time can be evaluated
as inputs into changes in the treatment plan.
Connected systems
Continuous subcutaneous insulin infusion, commonly known as insulin pumps,
provide a way for people with diabetes to receive a continuous supply of insulin
24/7, eliminating the need for multiple daily injections. Insulin, typically rapid-
acting, is delivered from the pump two ways. Small microdoses, called basal insulin,
are preprogrammed by the user to be delivered automatically as often as every 5 min
throughout the day, and basal delivery profiles can be temporarily adjusted by the