
Page 232 - Glucose Monitoring Devices
P. 232
Appendix: data preprocessing 235
Adults Pediatrics
18 CGM 18 CGM
Retrofitted CGM Retrofitted CGM
SMBG SMBG
16 16
Mean AD [mg/dl] 14 Mean AD [mg/dl] 14
12
12
10 10
8 8
10 8 6 4 2 10 8 6 4 2
N [references/admission] N [references/admission]
SMBG SMBG
Adults Pediatrics
11 11
CGM CGM
10 Retrofitted CGM 10 Retrofitted CGM
SMBG SMBG
9 9
Mean ARD [%] 8 7 Mean ARD [%] 8 7
6 6
5 5
4 4
10 8 6 4 2 10 8 6 4 2
N [references/admission] N [references/admission]
SMBG SMBG
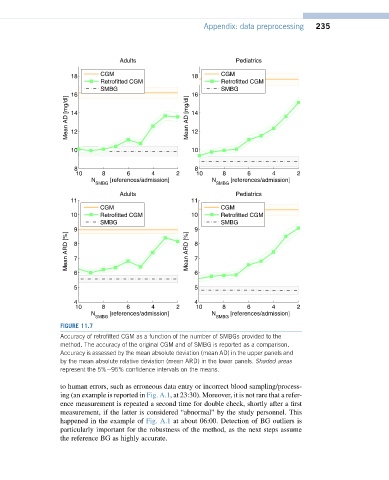
FIGURE 11.7
Accuracy of retrofitted CGM as a function of the number of SMBGs provided to the
method. The accuracy of the original CGM and of SMBG is reported as a comparison.
Accuracy is assessed by the mean absolute deviation (mean AD) in the upper panels and
by the mean absolute relative deviation (mean ARD) in the lower panels. Shaded areas
represent the 5%e95% confidence intervals on the means.
to human errors, such as erroneous data entry or incorrect blood sampling/process-
ing (an example is reported in Fig. A.1, at 23:30). Moreover, it is not rare that a refer-
ence measurement is repeated a second time for double check, shortly after a first
measurement, if the latter is considered “abnormal” by the study personnel. This
happened in the example of Fig. A.1 at about 06:00. Detection of BG outliers is
particularly important for the robustness of the method, as the next steps assume
the reference BG as highly accurate.