
Page 227 - Glucose Monitoring Devices
P. 227
230 CHAPTER 11 Retrofitting CGM traces
Clarke’s Error Grid Analysis Rate Grid − CGEGA
100 100
Percent in zone A [%] 80 Percent in zone Ar [%] 80
90
60
70
40
CGM Retrofitted CGM 60 CGM Retrofitted CGM
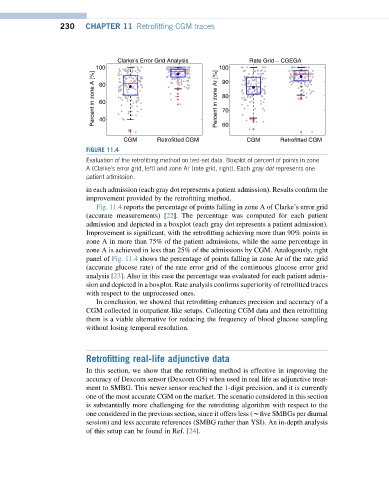
FIGURE 11.4
Evaluation of the retrofitting method on test-set data. Boxplot of percent of points in zone
A (Clarke’s error grid, left) and zone Ar (rate grid, right). Each gray dot represents one
patient admission.
in each admission (each gray dot represents a patient admission). Results confirm the
improvement provided by the retrofitting method.
Fig. 11.4 reports the percentage of points falling in zone A of Clarke’s error grid
(accurate measurements) [22]. The percentage was computed for each patient
admission and depicted in a boxplot (each gray dot represents a patient admission).
Improvement is significant, with the retrofitting achieving more than 90% points in
zone A in more than 75% of the patient admissions, while the same percentage in
zone A is achieved in less than 25% of the admissions by CGM. Analogously, right
panel of Fig. 11.4 shows the percentage of points falling in zone Ar of the rate grid
(accurate glucose rate) of the rate error grid of the continuous glucose error grid
analysis [23]. Also in this case the percentage was evaluated for each patient admis-
sion and depicted in a boxplot. Rate analysis confirms superiority of retrofitted traces
with respect to the unprocessed ones.
In conclusion, we showed that retrofitting enhances precision and accuracy of a
CGM collected in outpatient-like setups. Collecting CGM data and then retrofitting
them is a viable alternative for reducing the frequency of blood glucose sampling
without losing temporal resolution.
Retrofitting real-life adjunctive data
In this section, we show that the retrofitting method is effective in improving the
accuracy of Dexcom sensor (Dexcom G5) when used in real life as adjunctive treat-
ment to SMBG. This newer sensor reached the 1-digit precision, and it is currently
one of the most accurate CGM on the market. The scenario considered in this section
is substantially more challenging for the retrofitting algorithm with respect to the
one considered in the previous section, since it offers less (wfive SMBGs per diurnal
session) and less accurate references (SMBG rather than YSI). An in-depth analysis
of this setup can be found in Ref. [24].