
Page 226 - Glucose Monitoring Devices
P. 226
Retrofitting outpatient study data 229
Results
Fig. 11.2, bottom panel, shows the outcome of the retrofitting technique in a repre-
sentative subject (Patient 1, admission 2). CGM trace is depicted in light blue. Full
red dots denote BG measurement assigned to the training set and therefore acces-
sible to the retrofitting method. The output of the retrofitting method (tick red
line) has to be compared with the test BG references (empty diamonds). The accu-
racy improvement with respect to CGM is clear also at visual inspection.
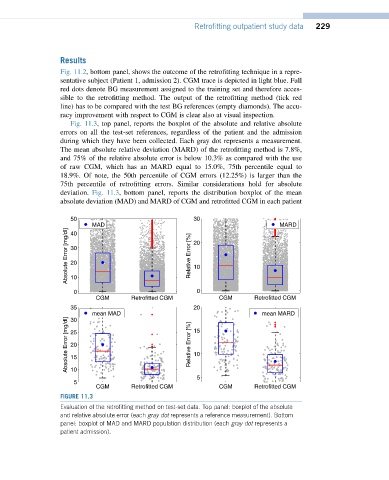
Fig. 11.3, top panel, reports the boxplot of the absolute and relative absolute
errors on all the test-set references, regardless of the patient and the admission
during which they have been collected. Each gray dot represents a measurement.
The mean absolute relative deviation (MARD) of the retrofitting method is 7.8%,
and 75% of the relative absolute error is below 10.3% as compared with the use
of raw CGM, which has an MARD equal to 15.0%, 75th percentile equal to
18.9%. Of note, the 50th percentile of CGM errors (12.25%) is larger than the
75th percentile of retrofitting errors. Similar considerations hold for absolute
deviation. Fig. 11.3, bottom panel, reports the distribution boxplot of the mean
absolute deviation (MAD) and MARD of CGM and retrofitted CGM in each patient
50 30
MAD MARD
Absolute Error [mg/dl] 30 Relative Error [%] 20
40
20
10
10
0 0
CGM Retrofitted CGM CGM Retrofitted CGM
35 20
mean MAD mean MARD
Absolute Error [mg/dl] 25 Relative Error [%] 15
30
20
10
15
10
5
5
CGM Retrofitted CGM CGM Retrofitted CGM
FIGURE 11.3
Evaluation of the retrofitting method on test-set data. Top panel: boxplot of the absolute
and relative absolute error (each gray dot represents a reference measurement). Bottom
panel: boxplot of MAD and MARD population distribution (each gray dot represents a
patient admission).