
Page 229 - Glucose Monitoring Devices
P. 229
232 CHAPTER 11 Retrofitting CGM traces
Adults Pediatrics
30 30
MAD 25 MAD
25
Absolute Difference [mg/dl] 20 Absolute Difference [mg/dl] 20
15
15
10
10
0 5 5 0
CGM Retrofitted CGM CGM Retrofitted CGM
Adults Pediatrics
15 15
MARD MARD
Absolute Relative Difference [%] 10 5 Absolute Relative Difference [%] 10 5
0 0
CGM Retrofitted CGM CGM Retrofitted CGM
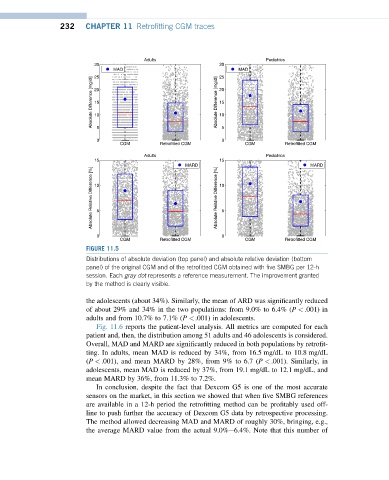
FIGURE 11.5
Distributions of absolute deviation (top panel) and absolute relative deviation (bottom
panel) of the original CGM and of the retrofitted CGM obtained with five SMBG per 12-h
session. Each gray dot represents a reference measurement. The improvement granted
by the method is clearly visible.
the adolescents (about 34%). Similarly, the mean of ARD was significantly reduced
of about 29% and 34% in the two populations: from 9.0% to 6.4% (P < .001) in
adults and from 10.7% to 7.1% (P <.001) in adolescents.
Fig. 11.6 reports the patient-level analysis. All metrics are computed for each
patient and, then, the distribution among 51 adults and 46 adolescents is considered.
Overall, MAD and MARD are significantly reduced in both populations by retrofit-
ting. In adults, mean MAD is reduced by 34%, from 16.5 mg/dL to 10.8 mg/dL
(P <.001), and mean MARD by 28%, from 9% to 6.7 (P < .001). Similarly, in
adolescents, mean MAD is reduced by 37%, from 19.1 mg/dL to 12.1 mg/dL, and
mean MARD by 36%, from 11.3% to 7.2%.
In conclusion, despite the fact that Dexcom G5 is one of the most accurate
sensors on the market, in this section we showed that when five SMBG references
are available in a 12-h period the retrofitting method can be profitably used off-
line to push further the accuracy of Dexcom G5 data by retrospective processing.
The method allowed decreasing MAD and MARD of roughly 30%, bringing, e.g.,
the average MARD value from the actual 9.0%e6.4%. Note that this number of