
Page 180 - Green Building Through Integrated Design
P. 180
156 INTEGRATED PROJECT MANAGEMENT—COST/BENEFIT ANALYSIS OF GREEN BUILDINGS
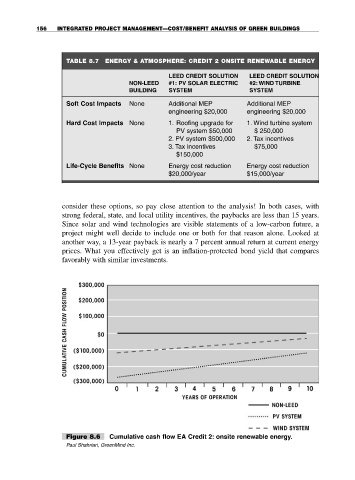
TABLE 8.7 ENERGY & ATMOSPHERE: CREDIT 2 ONSITE RENEWABLE ENERGY
LEED CREDIT SOLUTION LEED CREDIT SOLUTION
NON-LEED #1: PV SOLAR ELECTRIC #2: WIND TURBINE
BUILDING SYSTEM SYSTEM
Soft Cost Impacts None Additional MEP Additional MEP
engineering $20,000 engineering $20,000
Hard Cost Impacts None 1. Roofing upgrade for 1. Wind turbine system
PV system $50,000 $ 250,000
2. PV system $500,000 2. Tax incentives
3. Tax incentives $75,000
$150,000
Life-Cycle Benefits None Energy cost reduction Energy cost reduction
$20,000/year $15,000/year
consider these options, so pay close attention to the analysis! In both cases, with
strong federal, state, and local utility incentives, the paybacks are less than 15 years.
Since solar and wind technologies are visible statements of a low-carbon future, a
project might well decide to include one or both for that reason alone. Looked at
another way, a 13-year payback is nearly a 7 percent annual return at current energy
prices. What you effectively get is an inflation-protected bond yield that compares
favorably with similar investments.
Figure 8.6 Cumulative cash flow EA Credit 2: onsite renewable energy.
Paul Shahriari, GreenMind Inc.