
Page 179 - Green Building Through Integrated Design
P. 179
LEED RATING SYSTEM AND EVA 155
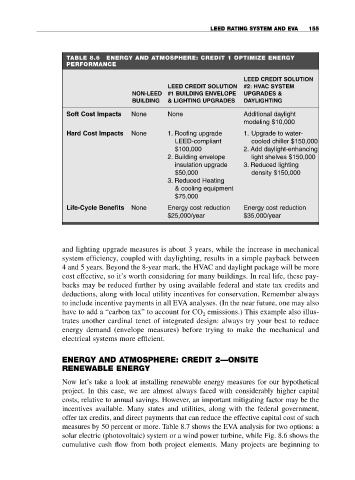
TABLE 8.6 ENERGY AND ATMOSPHERE: CREDIT 1 OPTIMIZE ENERGY
PERFORMANCE
LEED CREDIT SOLUTION
LEED CREDIT SOLUTION #2: HVAC SYSTEM
NON-LEED #1 BUILDING ENVELOPE UPGRADES &
BUILDING & LIGHTING UPGRADES DAYLIGHTING
Soft Cost Impacts None None Additional daylight
modeling $10,000
Hard Cost Impacts None 1. Roofing upgrade 1. Upgrade to water-
LEED-compliant cooled chiller $150,000
$100,000 2. Add daylight-enhancing
2. Building envelope light shelves $150,000
insulation upgrade 3. Reduced lighting
$50,000 density $150,000
3. Reduced Heating
& cooling equipment
$75,000
Life-Cycle Benefits None Energy cost reduction Energy cost reduction
$25,000/year $35,000/year
and lighting upgrade measures is about 3 years, while the increase in mechanical
system efficiency, coupled with daylighting, results in a simple payback between
4 and 5 years. Beyond the 8-year mark, the HVAC and daylight package will be more
cost effective, so it’s worth considering for many buildings. In real life, these pay-
backs may be reduced further by using available federal and state tax credits and
deductions, along with local utility incentives for conservation. Remember always
to include incentive payments in all EVA analyses. (In the near future, one may also
have to add a “carbon tax” to account for CO emissions.) This example also illus-
2
trates another cardinal tenet of integrated design: always try your best to reduce
energy demand (envelope measures) before trying to make the mechanical and
electrical systems more efficient.
ENERGY AND ATMOSPHERE: CREDIT 2—ONSITE
RENEWABLE ENERGY
Now let’s take a look at installing renewable energy measures for our hypothetical
project. In this case, we are almost always faced with considerably higher capital
costs, relative to annual savings. However, an important mitigating factor may be the
incentives available. Many states and utilities, along with the federal government,
offer tax credits, and direct payments that can reduce the effective capital cost of such
measures by 50 percent or more. Table 8.7 shows the EVA analysis for two options: a
solar electric (photovoltaic) system or a wind power turbine, while Fig. 8.6 shows the
cumulative cash flow from both project elements. Many projects are beginning to