
Page 75 - Green Building Through Integrated Design
P. 75
52 THE PRACTICE OF INTEGRATED DESIGN
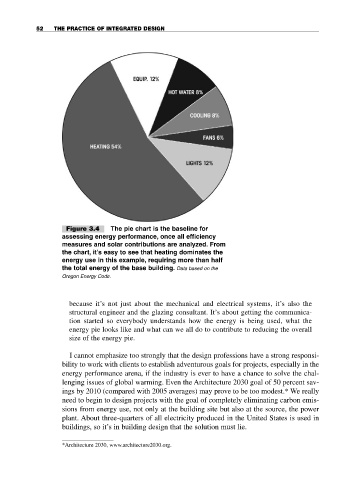
Figure 3.4 The pie chart is the baseline for
assessing energy performance, once all efficiency
measures and solar contributions are analyzed. From
the chart, it’s easy to see that heating dominates the
energy use in this example, requiring more than half
the total energy of the base building. Data based on the
Oregon Energy Code.
because it’s not just about the mechanical and electrical systems, it’s also the
structural engineer and the glazing consultant. It’s about getting the communica-
tion started so everybody understands how the energy is being used, what the
energy pie looks like and what can we all do to contribute to reducing the overall
size of the energy pie.
I cannot emphasize too strongly that the design professions have a strong responsi-
bility to work with clients to establish adventurous goals for projects, especially in the
energy performance arena, if the industry is ever to have a chance to solve the chal-
lenging issues of global warming. Even the Architecture 2030 goal of 50 percent sav-
ings by 2010 (compared with 2005 averages) may prove to be too modest.* We really
need to begin to design projects with the goal of completely eliminating carbon emis-
sions from energy use, not only at the building site but also at the source, the power
plant. About three-quarters of all electricity produced in the United States is used in
buildings, so it’s in building design that the solution must lie.
*Architecture 2030, www.architecture2030.org.