
Page 287 -
P. 287
P
258
258 P a r t V : a r t V : T T h e G r e e n i n g P r o c e s sh e G r e e n i n g P r o c e s s
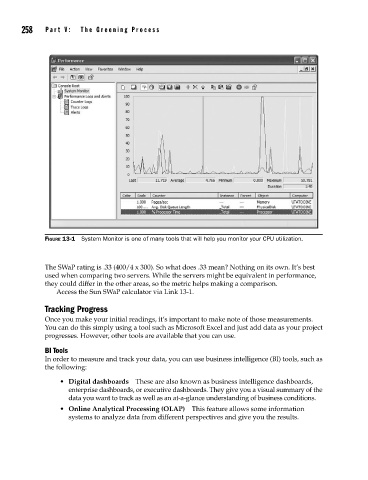
FIGURE 13-1 System Monitor is one of many tools that will help you monitor your CPU utilization.
The SWaP rating is .33 (400/4 x 300). So what does .33 mean? Nothing on its own. It’s best
used when comparing two servers. While the servers might be equivalent in performance,
they could differ in the other areas, so the metric helps making a comparison.
Access the Sun SWaP calculator via Link 13-1.
Tracking Progress
Once you make your initial readings, it’s important to make note of those measurements.
You can do this simply using a tool such as Microsoft Excel and just add data as your project
progresses. However, other tools are available that you can use.
BI Tools
In order to measure and track your data, you can use business intelligence (BI) tools, such as
the following:
• Digital dashboards These are also known as business intelligence dashboards,
enterprise dashboards, or executive dashboards. They give you a visual summary of the
data you want to track as well as an at-a-glance understanding of business conditions.
• Online Analytical Processing (OLAP) This feature allows some information
systems to analyze data from different perspectives and give you the results.