
Page 343 - Handbook of Thermal Analysis of Construction Materials
P. 343
320 Chapter 8 - Supplementary Cementing Materials
Thermal analysis techniques have been applied to determine the
decomposition of RHA and also to investigate the hydration characteristics
of RHA-cement pastes exposed to different conditions. The reported results
of DTA, DSC, and TG of RHA-cement pastes show variations. The thermal
curves of RHA from different sources are not comparable because of
variation in their physico-chemical characteristics, the conditions under
which the husk is heated, and other factors. [4][54]–[58] Thermograms gener-
ally show endothermal and exothermal peaks. Those ashes formed at lower
temperatures show an exothermal effect for the oxidation of the unburned
carbon. Endothermal effects at about 100°C denote the expulsion of water
from the adsorbed surface. The oxidation reactions correspond to the loss
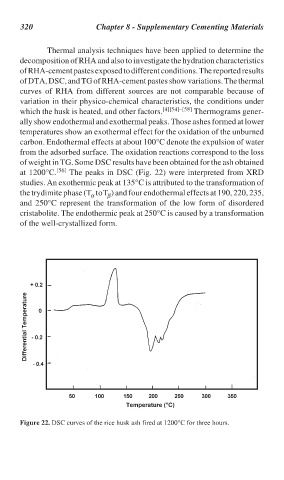
of weight in TG. Some DSC results have been obtained for the ash obtained
at 1200°C. [56] The peaks in DSC (Fig. 22) were interpreted from XRD
studies. An exothermic peak at 135°C is attributed to the transformation of
the trydimite phase (T to T ) and four endothermal effects at 190, 220, 235,
α
β
and 250°C represent the transformation of the low form of disordered
cristabolite. The endothermic peak at 250°C is caused by a transformation
of the well-crystallized form.
Figure 22. DSC curves of the rice husk ash fired at 1200°C for three hours.