
Page 512 - Handbook of Thermal Analysis of Construction Materials
P. 512
484 Chapter 11 - Gypsum and Gypsum Products
9.3 Sedimentary Rocks Containing Gypsum
A method for estimation of gypsum in sedimentary rocks by TG and
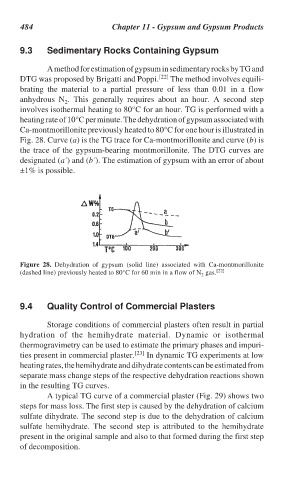
DTG was proposed by Brigatti and Poppi. [22] The method involves equili-
brating the material to a partial pressure of less than 0.01 in a flow
anhydrous N . This generally requires about an hour. A second step
2
involves isothermal heating to 80°C for an hour. TG is performed with a
heating rate of 10°C per minute. The dehydration of gypsum associated with
Ca-montmorillonite previously heated to 80°C for one hour is illustrated in
Fig. 28. Curve (a) is the TG trace for Ca-montmorillonite and curve (b) is
the trace of the gypsum-bearing montmorillonite. The DTG curves are
designated (a´) and (b´). The estimation of gypsum with an error of about
±1% is possible.
Figure 28. Dehydration of gypsum (solid line) associated with Ca-montmorillonite
(dashed line) previously heated to 80°C for 60 min in a flow of N gas. [22]
2
9.4 Quality Control of Commercial Plasters
Storage conditions of commercial plasters often result in partial
hydration of the hemihydrate material. Dynamic or isothermal
thermogravimetry can be used to estimate the primary phases and impuri-
ties present in commercial plaster. [23] In dynamic TG experiments at low
heating rates, the hemihydrate and dihydrate contents can be estimated from
separate mass change steps of the respective dehydration reactions shown
in the resulting TG curves.
A typical TG curve of a commercial plaster (Fig. 29) shows two
steps for mass loss. The first step is caused by the dehydration of calcium
sulfate dihydrate. The second step is due to the dehydration of calcium
sulfate hemihydrate. The second step is attributed to the hemihydrate
present in the original sample and also to that formed during the first step
of decomposition.