
Page 552 - Handbook of Thermal Analysis of Construction Materials
P. 552
522 Chapter 12 - Clay-Based Construction Products
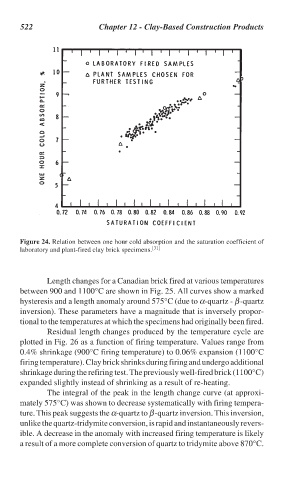
Figure 24. Relation between one hour cold absorption and the saturation coefficient of
laboratory and plant-fired clay brick specimens. [31]
Length changes for a Canadian brick fired at various temperatures
between 900 and 1100°C are shown in Fig. 25. All curves show a marked
hysteresis and a length anomaly around 575°C (due to α-quartz - β-quartz
inversion). These parameters have a magnitude that is inversely propor-
tional to the temperatures at which the specimens had originally been fired.
Residual length changes produced by the temperature cycle are
plotted in Fig. 26 as a function of firing temperature. Values range from
0.4% shrinkage (900°C firing temperature) to 0.06% expansion (1100°C
firing temperature). Clay brick shrinks during firing and undergo additional
shrinkage during the refiring test. The previously well-fired brick (1100°C)
expanded slightly instead of shrinking as a result of re-heating.
The integral of the peak in the length change curve (at approxi-
mately 575°C) was shown to decrease systematically with firing tempera-
ture. This peak suggests the α-quartz to β-quartz inversion. This inversion,
unlike the quartz-tridymite conversion, is rapid and instantaneously revers-
ible. A decrease in the anomaly with increased firing temperature is likely
a result of a more complete conversion of quartz to tridymite above 870°C.