
Page 555 - Handbook of Thermal Analysis of Construction Materials
P. 555
Section 4.0 - Durability of Clay Bricks 525
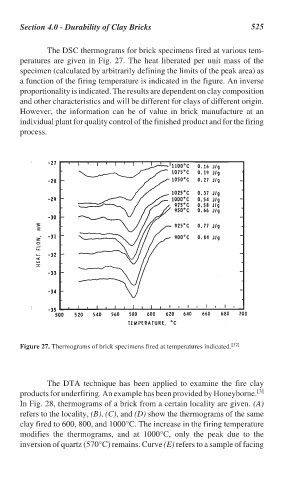
The DSC thermograms for brick specimens fired at various tem-
peratures are given in Fig. 27. The heat liberated per unit mass of the
specimen (calculated by arbitrarily defining the limits of the peak area) as
a function of the firing temperature is indicated in the figure. An inverse
proportionality is indicated. The results are dependent on clay composition
and other characteristics and will be different for clays of different origin.
However, the information can be of value in brick manufacture at an
individual plant for quality control of the finished product and for the firing
process.
Figure 27. Thermograms of brick specimens fired at temperatures indicated. [32]
The DTA technique has been applied to examine the fire clay
products for underfiring. An example has been provided by Honeyborne. [3]
In Fig. 28, thermograms of a brick from a certain locality are given. (A)
refers to the locality, (B), (C), and (D) show the thermograms of the same
clay fired to 600, 800, and 1000°C. The increase in the firing temperature
modifies the thermograms, and at 1000°C, only the peak due to the
inversion of quartz (570°C) remains. Curve (E) refers to a sample of facing