
Page 237 - Handbook Of Multiphase Flow Assurance
P. 237
236 10. Research methods in flow assurance
R is the universal gas constant. If Δ d H/Z were constant over the temperature range, a plot
of ln P against 1/T would be linear within a single structure. On the other hand, a non-linear
plot might indicate either a hydrate crystal structure change, or a variable Δ d H/Z.
Methane hydrate experiments
Data in the literature for methane hydrate
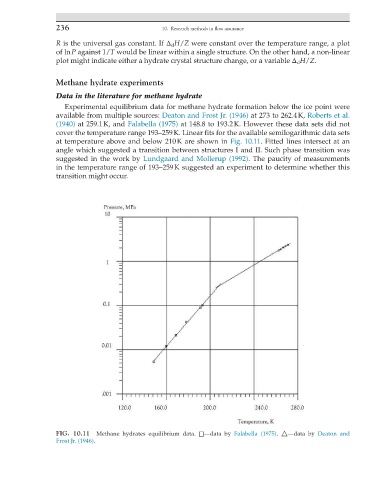
Experimental equilibrium data for methane hydrate formation below the ice point were
available from multiple sources: Deaton and Frost Jr. (1946) at 273 to 262.4 K, Roberts et al.
(1940) at 259.1 K, and Falabella (1975) at 148.8 to 193.2 K. However these data sets did not
cover the temperature range 193–259 K. Linear fits for the available semilogarithmic data sets
at temperature above and below 210 K are shown in Fig. 10.11. Fitted lines intersect at an
angle which suggested a transition between structures I and II. Such phase transition was
suggested in the work by Lundgaard and Mollerup (1992). The paucity of measurements
in the temperature range of 193–259 K suggested an experiment to determine whether this
transition might occur.
FIG. 10.11 Methane hydrates equilibrium data. □—data by Falabella (1975). △—data by Deaton and
Frost Jr. (1946).