
Page 239 - Handbook Of Multiphase Flow Assurance
P. 239
238 10. Research methods in flow assurance
Pressure
hydrates hydrates
form form
error
P eq
in data
hydrates
decompose
hydrates
decompose
0
0 Time
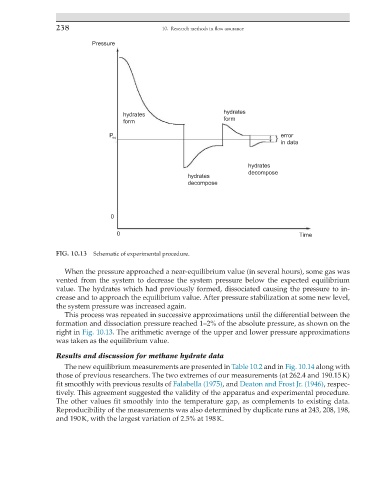
FIG. 10.13 Schematic of experimental procedure.
When the pressure approached a near-equilibrium value (in several hours), some gas was
vented from the system to decrease the system pressure below the expected equilibrium
value. The hydrates which had previously formed, dissociated causing the pressure to in-
crease and to approach the equilibrium value. After pressure stabilization at some new level,
the system pressure was increased again.
This process was repeated in successive approximations until the differential between the
formation and dissociation pressure reached 1–2% of the absolute pressure, as shown on the
right in Fig. 10.13. The arithmetic average of the upper and lower pressure approximations
was taken as the equilibrium value.
Results and discussion for methane hydrate data
The new equilibrium measurements are presented in Table 10.2 and in Fig. 10.14 along with
those of previous researchers. The two extremes of our measurements (at 262.4 and 190.15 K)
fit smoothly with previous results of Falabella (1975), and Deaton and Frost Jr. (1946), respec-
tively. This agreement suggested the validity of the apparatus and experimental procedure.
The other values fit smoothly into the temperature gap, as complements to existing data.
Reproducibility of the measurements was also determined by duplicate runs at 243, 208, 198,
and 190 K, with the largest variation of 2.5% at 198 K.