
Page 318 - Handbook Of Multiphase Flow Assurance
P. 318
Computer modeling of interaction between a hydrate surface and an inhibitor 317
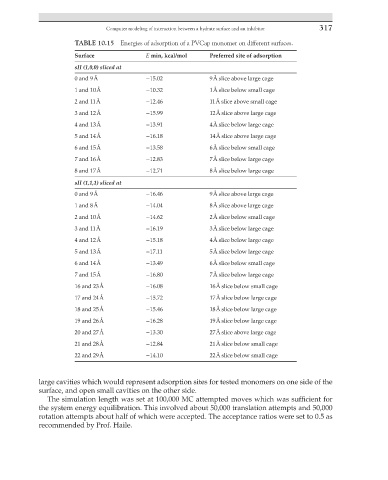
TABLE 10.15 Energies of adsorption of a PVCap monomer on different surfaces.
Surface E min, kcal/mol Preferred site of adsorption
sII (1,0,0) sliced at
0 and 9 Å −15.02 9 Å slice above large cage
1 and 10 Å −10.32 1 Å slice below small cage
2 and 11 Å −12.46 11 Å slice above small cage
3 and 12 Å −15.99 12 Å slice above large cage
4 and 13 Å −13.91 4 Å slice below large cage
5 and 14 Å −16.18 14 Å slice above large cage
6 and 15 Å −13.58 6 Å slice below small cage
7 and 16 Å −12.83 7 Å slice below large cage
8 and 17 Å −12.71 8 Å slice below large cage
sII (1,1,1) sliced at
0 and 9 Å −16.46 9 Å slice above large cage
1 and 8 Å −14.04 8 Å slice above large cage
2 and 10 Å −14.62 2 Å slice below small cage
3 and 11 Å −16.19 3 Å slice below large cage
4 and 12 Å −15.18 4 Å slice below large cage
5 and 13 Å −17.11 5 Å slice below large cage
6 and 14 Å −13.49 6 Å slice below small cage
7 and 15 Å −16.80 7 Å slice below large cage
16 and 23 Å −16.08 16 Å slice below small cage
17 and 24 Å −15.72 17 Å slice below large cage
18 and 25 Å −15.46 18 Å slice below large cage
19 and 26 Å −16.28 19 Å slice below large cage
20 and 27 Å −13.30 27 Å slice above large cage
21 and 28 Å −12.84 21 Å slice below small cage
22 and 29 Å −14.10 22 Å slice below small cage
large cavities which would represent adsorption sites for tested monomers on one side of the
surface, and open small cavities on the other side.
The simulation length was set at 100,000 MC attempted moves which was sufficient for
the system energy equilibration. This involved about 50,000 translation attempts and 50,000
rotation attempts about half of which were accepted. The acceptance ratios were set to 0.5 as
recommended by Prof. Haile.