
Page 319 - Handbook Of Multiphase Flow Assurance
P. 319
318 10. Research methods in flow assurance
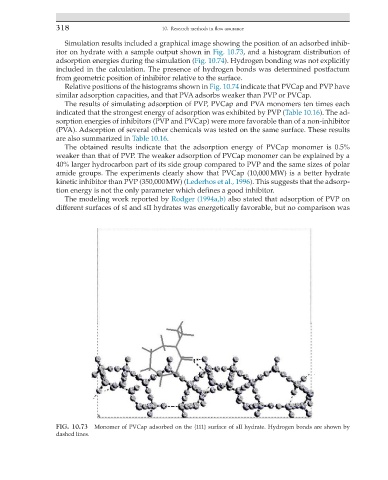
Simulation results included a graphical image showing the position of an adsorbed inhib-
itor on hydrate with a sample output shown in Fig. 10.73, and a histogram distribution of
adsorption energies during the simulation (Fig. 10.74). Hydrogen bonding was not explicitly
included in the calculation. The presence of hydrogen bonds was determined postfactum
from geometric position of inhibitor relative to the surface.
Relative positions of the histograms shown in Fig. 10.74 indicate that PVCap and PVP have
similar adsorption capacities, and that PVA adsorbs weaker than PVP or PVCap.
The results of simulating adsorption of PVP, PVCap and PVA monomers ten times each
indicated that the strongest energy of adsorption was exhibited by PVP (Table 10.16). The ad-
sorption energies of inhibitors (PVP and PVCap) were more favorable than of a non-inhibitor
(PVA). Adsorption of several other chemicals was tested on the same surface. These results
are also summarized in Table 10.16.
The obtained results indicate that the adsorption energy of PVCap monomer is 0.5%
weaker than that of PVP. The weaker adsorption of PVCap monomer can be explained by a
40% larger hydrocarbon part of its side group compared to PVP and the same sizes of polar
amide groups. The experiments clearly show that PVCap (10,000 MW) is a better hydrate
kinetic inhibitor than PVP (350,000 MW) (Lederhos et al., 1996). This suggests that the adsorp-
tion energy is not the only parameter which defines a good inhibitor.
The modeling work reported by Rodger (1994a,b) also stated that adsorption of PVP on
different surfaces of sI and sII hydrates was energetically favorable, but no comparison was
FIG. 10.73 Monomer of PVCap adsorbed on the {111} surface of sII hydrate. Hydrogen bonds are shown by
dashed lines.