
Page 82 - Handbook Of Multiphase Flow Assurance
P. 82
Hydrodynamics of multiphase flow 77
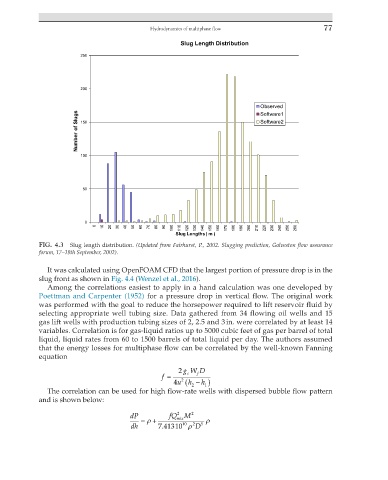
Slug Length Distribution
250
200
Observed
Number of Slugs 150 Software2
Software1
100
50
0
0 10 20 30 40 50 60 70 80 90 100 110 120 130 140 150 160 170 180 190 200 210 220 230 240 250 260
Slug Lengths ( m )
FIG. 4.3 Slug length distribution. (Updated from Fairhurst, P., 2002. Slugging prediction, Galveston flow assurance
forum, 17–19th September, 2002).
It was calculated using OpenFOAM CFD that the largest portion of pressure drop is in the
slug front as shown in Fig. 4.4 (Wenzel et al., 2016).
Among the correlations easiest to apply in a hand calculation was one developed by
Poettman and Carpenter (1952) for a pressure drop in vertical flow. The original work
was performed with the goal to reduce the horsepower required to lift reservoir fluid by
selecting appropriate well tubing size. Data gathered from 34 flowing oil wells and 15
gas lift wells with production tubing sizes of 2, 2.5 and 3 in. were correlated by at least 14
variables. Correlation is for gas-liquid ratios up to 5000 cubic feet of gas per barrel of total
liquid, liquid rates from 60 to 1500 barrels of total liquid per day. The authors assumed
that the energy losses for multiphase flow can be correlated by the well-known Fanning
equation
2 gW D
f = c f
(
2
4 uh − )
h
2
1
The correlation can be used for high flow-rate wells with dispersed bubble flow pattern
and is shown below:
dP = ρ + fQ 2 mix M 2 ρ
dh 7 41310 10 ρ 2 D 5
.