
Page 83 - Handbook Of Multiphase Flow Assurance
P. 83
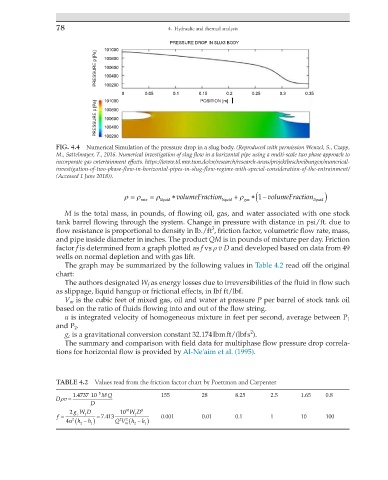
78                             4.  Hydraulic and thermal analysis

                                                PRESSURE DROP IN SLUG BODY
                              101000
                            PRESSURE p [Pa]  100600
                              100800

                              100400
                              100200
                                   0     0.05    0.1    0.15    0.2    0.25    0.3    0.35
                              101000
                                                         POSITION [m]
                            PRESSURE p [Pa]  100800
                              100600
                              100400
                              100200
                 FIG. 4.4  Numerical Simulation of the pressure drop in a slug body. (Reproduced with permission Wenzel, S., Czapp,
                 M., Sattelmayer, T., 2016. Numerical investigation of slug flow in a horizontal pipe using a multi-scale two phase approach to
                 incorporate gas entertainment effects. https://www.td.mw.tum.de/en/research/research-areas/projektbeschreibungen/ numerical-
                 investigation-of-two-phase-flow-in-horizontal-pipes-in-slug-flow-regime-with-special-consideration-of-the-entrainment/
                 (Accessed 1 June 2018)).

                                    ρ =  ρ  =  ρ  ∗volumeFraction  + ρ  ∗ 1 (  − volumeFraction )
                                        mix   liquid           liquid  gas              liiquid
                   M is the total mass, in pounds, of flowing oil, gas, and water associated with one stock
                 tank barrel flowing through the system. Change in pressure with distance in psi/ft. due to
                                                            3
                 flow resistance is proportional to density in lb./ft , friction factor, volumetric flow rate, mass,
                 and pipe inside diameter in inches. The product QM is in pounds of mixture per day. Friction
                 factor f is determined from a graph plotted as f vs ρ v D and developed based on data from 49
                 wells on normal depletion and with gas lift.
                   The graph may be summarized by the following values in Table 4.2 read off the original
                 chart:
                   The authors designated W f  as energy losses due to irreversibilities of the fluid in flow such
                 as slippage, liquid hangup or frictional effects, in lbf ft/lbf.
                   V m  is the cubic feet of mixed gas, oil and water at pressure P per barrel of stock tank oil
                 based on the ratio of fluids flowing into and out of the flow string.
                   u is integrated velocity of homogeneous mixture in feet per second, average between P 1
                 and P 2 .
                                                                       2
                   g c  is a gravitational conversion constant 32.174 lbm ft/(lbf s ).
                   The summary and comparison with field data for multiphase flow pressure drop correla-
                 tions for horizontal flow is provided by Al-Ne'aim et al. (1995).


                 TABLE 4.2  Values read from the friction factor chart by Poettman and Carpenter
                      .
                     1 4737 10 −5 MQ          155        28       8.25      2.5      1.65  0.8
                  ρ
                 D v =
                          D
                    2  gW D       10 10 WD 5
                 f =  c  f  = 7 413    f      0.001      0.01     0.1       1        10    100
                              .
                      (
                                    2
                                        h
                                  2
                         h
                   4 uh − )      QV ( h − )
                     2
                       2
                                      2
                                    m
                                         1
                          1