
Page 205 - Handbook of Battery Materials
P. 205
174 6 Lead Oxides
1.6
1.4
B PbO
1.2 1 2
Potential vs. stand. hydrogen el. / V 0.6 0 Pb 2+ A C D E PbO H 2 O / O 2
0.8
0.4
Pb 3 O 4
0.2
-0.2
-0.4
-0.6 F
Pb
+
H 2 / H
-0.8
-1
0123456789 10 11 12 13 14
pH value
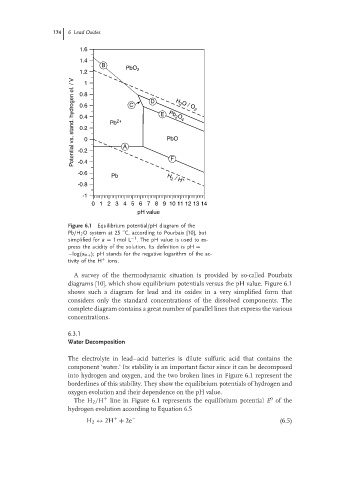
Figure 6.1 Equilibrium potential/pH diagram of the
Pb/H 2 Osystem at25 C, according to Pourbaix [10], but
◦
−1
simplified for a = 1mol L . The pH value is used to ex-
press the acidity of the solution. Its definition is pH =
−log(a H+ ); pH stands for the negative logarithm of the ac-
tivity of the H + ions.
A survey of the thermodynamic situation is provided by so-called Pourbaix
diagrams [10], which show equilibrium potentials versus the pH value. Figure 6.1
shows such a diagram for lead and its oxides in a very simplified form that
considers only the standard concentrations of the dissolved components. The
complete diagram contains a great number of parallel lines that express the various
concentrations.
6.3.1
Water Decomposition
The electrolyte in lead–acid batteries is dilute sulfuric acid that contains the
component ‘water.’ Its stability is an important factor since it can be decomposed
into hydrogen and oxygen, and the two broken lines in Figure 6.1 represent the
borderlines of this stability. They show the equilibrium potentials of hydrogen and
oxygen evolution and their dependence on the pH value.
0
+
The H 2 /H line in Figure 6.1 represents the equilibrium potential E of the
hydrogen evolution according to Equation 6.5
+
H 2 ↔ 2H + 2e − (6.5)