
Page 207 - Handbook of Battery Materials
P. 207
176 6 Lead Oxides
with the dependence on activities
RT
0,S
0
E 2+ = E + ln(a 2+ ) (6.13)
Pb/Pb Pb/Pb 2+ 2F Pb
and the standard value
E 0 =−0.126V (6.14)
Pb/PbSO 4
E 0 does not depend on the pH value. In Figure 6.1, the activity of SO 2−
Pb/Pb 2+ 4
−1
equals 1 mol L .
+
At small pH values, the curve A is below the H 2 /H curve, which means that lead
is not stable in an aqueous solution under these conditions, but is converted into
Pb 2+ ions, and simultaneously water is decomposed with formation of hydrogen H 2.
Curve B describes the corresponding relation for the oxidation of divalent lead
ions Pb 2+ → Pb , which implies the formation of lead dioxide since Pb 4+ does
4+
not exist alone:
+
Pb 2+ + 2H 2 O → PbO 2 + 4H + 4e − (6.15)
The dependence on H concentration (activity) is given by
+
RT a 4
0,S
E 0 = E + ln H (6.16)
Pb 2+ /PbO 2 Pb 2+ /PbO 2 2F a 2
H 2 O
and leads to a slope of 2 × 0.0592 = 0.1184 V per pH unit.
The standard value is:
E 0 = 1.459 V (6.17)
Pb 2+ /PbO 2
At small pH values, the curve B is above the H 2 O/O 2 curve, which means that lead
dioxide (Pb 4+ ions) is not stable in such an acidic aqueous solution, but is reduced to
Pb 2+ ions, and simultaneously water is decomposed with formation of oxygen (O 2 ).
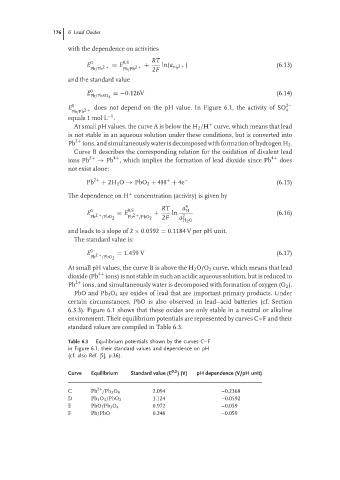
PbO and Pb 3 O 4 are oxides of lead that are important primary products. Under
certain circumstances, PbO is also observed in lead–acid batteries (cf. Section
6.3.3). Figure 6.1 shows that these oxides are only stable in a neutral or alkaline
environment. Their equilibrium potentials are represented by curves C–F and their
standard values are compiled in Table 6.3.
Table 6.3 Equilibrium potentials shown by the curves C–F
in Figure 6.1, their standard values and dependence on pH
(cf. also Ref. [5], p.36).
Curve Equilibrium Standard value (E 0,S ) (V) pH dependence (V/pH unit)
C Pb /Pb 3 O 4 2.094 –0.2368
2+
D Pb 3 O 4 /PbO 2 1.124 –0.0592
E PbO/Pb 3 O 4 0.972 –0.059
F Pb/PbO 0.248 –0.059