
Page 209 - Handbook of Battery Materials
P. 209
178 6 Lead Oxides
electrode potential is drawn on the vertical axis. The values are referred to the
above-mentioned SHE. To enlarge the scale, the range between 0 and 1.2 V is
omitted.
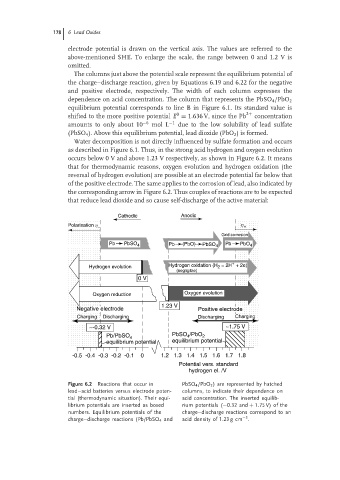
The columns just above the potential scale represent the equilibrium potential of
the charge–discharge reaction, given by Equations 6.19 and 6.22 for the negative
and positive electrode, respectively. The width of each column expresses the
dependence on acid concentration. The column that represents the PbSO 4 /PbO 2
equilibrium potential corresponds to line B in Figure 6.1. Its standard value is
0
shifted to the more positive potential E = 1.636 V, since the Pb 2+ concentration
amounts to only about 10 −6 mol L −1 due to the low solubility of lead sulfate
(PbSO 4 ). Above this equilibrium potential, lead dioxide (PbO 2 ) is formed.
Water decomposition is not directly influenced by sulfate formation and occurs
as described in Figure 6.1. Thus, in the strong acid hydrogen and oxygen evolution
occurs below 0 V and above 1.23 V respectively, as shown in Figure 6.2. It means
that for thermodynamic reasons, oxygen evolution and hydrogen oxidation (the
reversal of hydrogen evolution) are possible at an electrode potential far below that
of the positive electrode. The same applies to the corrosion of lead, also indicated by
the corresponding arrow in Figure 6.2. Thus couples of reactions are to be expected
that reduce lead dioxide and so cause self-discharge of the active material:
Cathodic Anodic
− h +
Polarisation h
Grid corrosion
Pb PbSO 4 Pb (PbO) PbSO 4 Pb PbO 4
+
Hydrogen evolution Hydrogen oxidation (H = 2H + 2e)
2
(negligible)
0 V
Oxygen reduction Oxygen evolution
1.23 V
Negative electrode Positive electrode
Charging Discharging Discharging Charging
~-0.32 V ~1.75 V
Pb/PbSO 4 PbSO /PbO 2
4
equilibrium potential equilibrium potential
-0.5 -0.4 -0.3 -0.2 -0.1 0 1.2 1.3 1.4 1.5 1.6 1.7 1.8
Potential vers. standard
hydrogen el. /V
Figure 6.2 Reactions that occur in PbSO 4 /PbO 2 ) are represented by hatched
lead–acid batteries versus electrode poten- columns, to indicate their dependence on
tial (thermodynamic situation). Their equi- acid concentration. The inserted equilib-
librium potentials are inserted as boxed rium potentials (−0.32 and + 1.75 V) of the
numbers. Equilibrium potentials of the charge–discharge reactions correspond to an
−3
charge–discharge reactions (Pb/PbSO 4 and acid density of 1.23 g cm .