
Page 529 - Handbook of Battery Materials
P. 529
502 16 The Anode/Electrolyte Interface
18
16
14
% OXYGEN 10 8
12
6
4
2
0 5 10 15 20 25 30 35
% BURNOFF
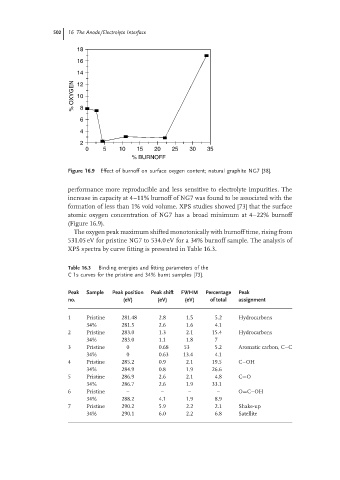
Figure 16.9 Effect of burnoff on surface oxygen content; natural graphite NG7 [38].
performance more reproducible and less sensitive to electrolyte impurities. The
increase in capacity at 4–11% burnoff of NG7 was found to be associated with the
formation of less than 1% void volume. XPS studies showed [73] that the surface
atomic oxygen concentration of NG7 has a broad minimum at 4–22% burnoff
(Figure 16.9).
The oxygen peak maximum shifted monotonically with burnoff time, rising from
531.05 eV for pristine NG7 to 534.0 eV for a 34% burnoff sample. The analysis of
XPS spectra by curve fitting is presented in Table 16.3.
Table 16.3 Binding energies and fitting parameters of the
C 1s curves for the pristine and 34% burnt samples [73].
Peak Sample Peak position Peak shift FWHM Percentage Peak
no. (eV) (eV) (eV) of total assignment
1 Pristine 281.48 2.8 1.5 5.2 Hydrocarbons
34% 281.5 2.6 1.6 4.1
2 Pristine 283.0 1.3 2.1 15.4 Hydrocarbons
34% 283.0 1.1 1.8 7
3 Pristine 0 0.68 53 5.2 Aromatic carbon, C–C
34% 0 0.63 13.4 4.1
4 Pristine 285.2 0.9 2.1 19.5 C–OH
34% 284.9 0.8 1.9 26.6
5 Pristine 286.9 2.6 2.1 4.8 C=O
34% 286.7 2.6 1.9 33.1
6 Pristine – – – – O=C–OH
34% 288.2 4.1 1.9 8.9
7 Pristine 290.2 5.9 2.2 2.1 Shake-up
34% 290.1 6.0 2.2 6.8 Satellite