
Page 532 - Handbook of Biomechatronics
P. 532
526 Graham Brooker
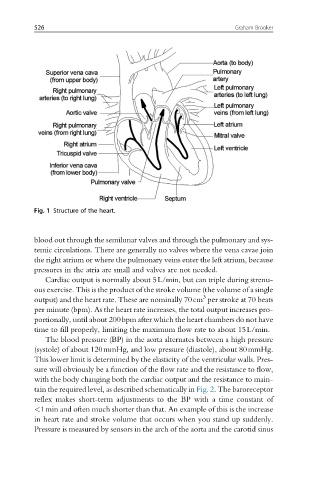
Fig. 1 Structure of the heart.
blood out through the semilunar valves and through the pulmonary and sys-
temic circulations. There are generally no valves where the vena cavae join
the right atrium or where the pulmonary veins enter the left atrium, because
pressures in the atria are small and valves are not needed.
Cardiac output is normally about 5L/min, but can triple during strenu-
ous exercise. This is the product of the stroke volume (the volume of a single
3
output) and the heart rate. These are nominally 70cm per stroke at 70 beats
per minute (bpm). As the heart rate increases, the total output increases pro-
portionally, until about 200bpm after which the heart chambers do not have
time to fill properly, limiting the maximum flow rate to about 15L/min.
The blood pressure (BP) in the aorta alternates between a high pressure
(systole) of about 120mmHg, and low pressure (diastole), about 80mmHg.
This lower limit is determined by the elasticity of the ventricular walls. Pres-
sure will obviously be a function of the flow rate and the resistance to flow,
with the body changing both the cardiac output and the resistance to main-
tain the required level, as described schematically in Fig. 2. The baroreceptor
reflex makes short-term adjustments to the BP with a time constant of
<1min and often much shorter than that. An example of this is the increase
in heart rate and stroke volume that occurs when you stand up suddenly.
Pressure is measured by sensors in the arch of the aorta and the carotid sinus