
Page 265 - Handbook of Instrumental Techniques for Analytical Chemistry
P. 265
Infrared Spectroscopy 255
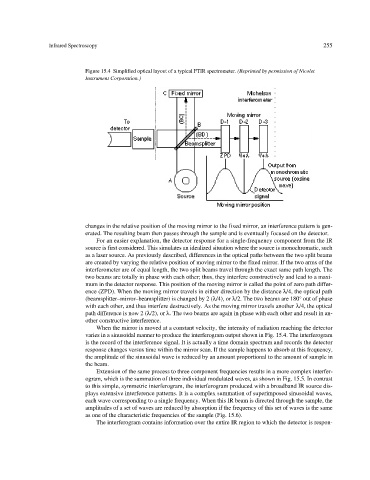
Figure 15.4 Simplified optical layout of a typical FTIR spectrometer. (Reprinted by permission of Nicolet
Instrument Corporation.)
changes in the relative position of the moving mirror to the fixed mirror, an interference pattern is gen-
erated. The resulting beam then passes through the sample and is eventually focused on the detector.
For an easier explanation, the detector response for a single-frequency component from the IR
source is first considered. This simulates an idealized situation where the source is monochromatic, such
as a laser source. As previously described, differences in the optical paths between the two split beams
are created by varying the relative position of moving mirror to the fixed mirror. If the two arms of the
interferometer are of equal length, the two split beams travel through the exact same path length. The
two beams are totally in phase with each other; thus, they interfere constructively and lead to a maxi-
mum in the detector response. This position of the moving mirror is called the point of zero path differ-
ence (ZPD). When the moving mirror travels in either direction by the distance l/4, the optical path
(beamsplitter–mirror–beamsplitter) is changed by 2 (l/4), or l/2. The two beams are 180° out of phase
with each other, and thus interfere destructively. As the moving mirror travels another l/4, the optical
path difference is now 2 (l/2), or l. The two beams are again in phase with each other and result in an-
other constructive interference.
When the mirror is moved at a constant velocity, the intensity of radiation reaching the detector
varies in a sinusoidal manner to produce the interferogram output shown in Fig. 15.4. The interferogram
is the record of the interference signal. It is actually a time domain spectrum and records the detector
response changes versus time within the mirror scan. If the sample happens to absorb at this frequency,
the amplitude of the sinusoidal wave is reduced by an amount proportional to the amount of sample in
the beam.
Extension of the same process to three component frequencies results in a more complex interfer-
ogram, which is the summation of three individual modulated waves, as shown in Fig. 15.5. In contrast
to this simple, symmetric interferogram, the interferogram produced with a broadband IR source dis-
plays extensive interference patterns. It is a complex summation of superimposed sinusoidal waves,
each wave corresponding to a single frequency. When this IR beam is directed through the sample, the
amplitudes of a set of waves are reduced by absorption if the frequency of this set of waves is the same
as one of the characteristic frequencies of the sample (Fig. 15.6).
The interferogram contains information over the entire IR region to which the detector is respon-