
Page 267 - Handbook of Instrumental Techniques for Analytical Chemistry
P. 267
Infrared Spectroscopy 257
more sensitive than the DTGS detector.
Spectrometer Design
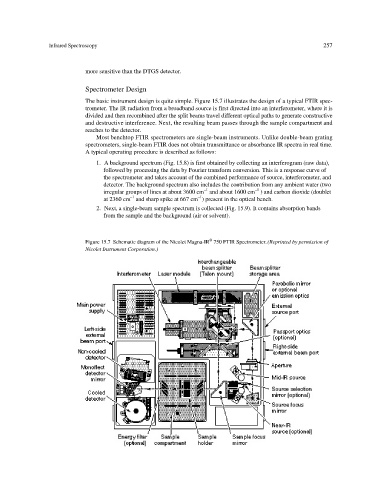
The basic instrument design is quite simple. Figure 15.7 illustrates the design of a typical FTIR spec-
trometer. The IR radiation from a broadband source is first directed into an interferometer, where it is
divided and then recombined after the split beams travel different optical paths to generate constructive
and destructive interference. Next, the resulting beam passes through the sample compartment and
reaches to the detector.
Most benchtop FTIR spectrometers are single-beam instruments. Unlike double-beam grating
spectrometers, single-beam FTIR does not obtain transmittance or absorbance IR spectra in real time.
A typical operating procedure is described as follows:
1. A background spectrum (Fig. 15.8) is first obtained by collecting an interferogram (raw data),
followed by processing the data by Fourier transform conversion. This is a response curve of
the spectrometer and takes account of the combined performance of source, interferometer, and
detector. The background spectrum also includes the contribution from any ambient water (two
–1 –1
irregular groups of lines at about 3600 cm and about 1600 cm ) and carbon dioxide (doublet
–1 –1
at 2360 cm and sharp spike at 667 cm ) present in the optical bench.
2. Next, a single-beam sample spectrum is collected (Fig. 15.9). It contains absorption bands
from the sample and the background (air or solvent).
®
Figure 15.7 Schematic diagram of the Nicolet Magna-IR 750 FTIR Spectrometer. (Reprinted by permission of
Nicolet Instrument Corporation.)