
Page 372 - Handbook of Materials Failure Analysis
P. 372
370 CHAPTER 14 Fatigue failure analysis of welded structures
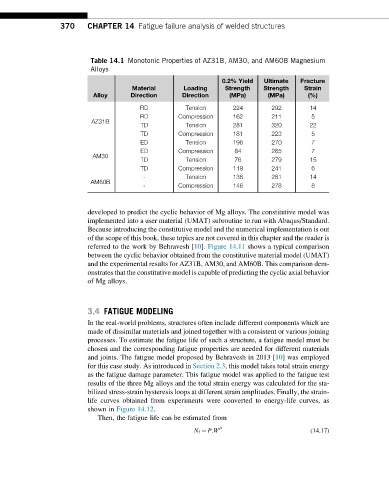
Table 14.1 Monotonic Properties of AZ31B, AM30, and AM60B Magnesium
Alloys
0.2% Yield Ultimate Fracture
Material Loading Strength Strength Strain
Alloy Direction Direction (MPa) (MPa) (%)
RD Tension 224 292 14
RD Compression 162 211 5
AZ31B
TD Tension 281 320 22
TD Compression 181 223 5
ED Tension 196 270 7
ED Compression 84 265 7
AM30
TD Tension 76 279 15
TD Compression 119 241 6
- Tension 138 281 14
AM60B
- Compression 146 278 8
developed to predict the cyclic behavior of Mg alloys. The constitutive model was
implemented into a user material (UMAT) subroutine to run with Abaqus/Standard.
Because introducing the constitutive model and the numerical implementation is out
of the scope of this book, these topics are not covered in this chapter and the reader is
referred to the work by Behravesh [10]. Figure 14.11 shows a typical comparison
between the cyclic behavior obtained from the constitutive material model (UMAT)
and the experimental results for AZ31B, AM30, and AM60B. This comparison dem-
onstrates that the constitutive model is capable of predicting the cyclic axial behavior
of Mg alloys.
3.4 FATIGUE MODELING
In the real-world problems, structures often include different components which are
made of dissimilar materials and joined together with a consistent or various joining
processes. To estimate the fatigue life of such a structure, a fatigue model must be
chosen and the corresponding fatigue properties are needed for different materials
and joints. The fatigue model proposed by Behravesh in 2013 [10] was employed
for this case study. As introduced in Section 2.3, this model takes total strain energy
as the fatigue damage parameter. This fatigue model was applied to the fatigue test
results of the three Mg alloys and the total strain energy was calculated for the sta-
bilized stress-strain hysteresis loops at different strain amplitudes. Finally, the strain-
life curves obtained from experiments were converted to energy-life curves, as
shown in Figure 14.12.
Then, the fatigue life can be estimated from
N f ¼ P:W t q (14.17)