
Page 374 - Handbook of Materials Failure Analysis
P. 374
372 CHAPTER 14 Fatigue failure analysis of welded structures
2
1.8
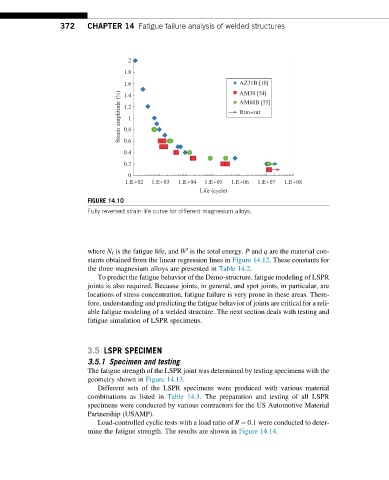
1.6 AZ31B [10]
AM30 [54]
Strain amplitude (%) 1.2 1 AM60B [55]
1.4
Run-out
0.8
0.6
0.4
0.2
0
1.E+02 1.E+03 1.E+04 1.E+05 1.E+06 1.E+07 1.E+08
Life (cycle)
FIGURE 14.10
Fully reversed strain-life curve for different magnesium alloys.
t
where N f is the fatigue life, and W is the total energy. P and q are the material con-
stants obtained from the linear regression lines in Figure 14.12. These constants for
the three magnesium alloys are presented in Table 14.2.
To predict the fatigue behavior of the Demo-structure, fatigue modeling of LSPR
joints is also required. Because joints, in general, and spot joints, in particular, are
locations of stress concentration, fatigue failure is very prone in these areas. There-
fore, understanding and predicting the fatigue behavior of joints are critical for a reli-
able fatigue modeling of a welded structure. The next section deals with testing and
fatigue simulation of LSPR specimens.
3.5 LSPR SPECIMEN
3.5.1 Specimen and testing
The fatigue strength of the LSPR joint was determined by testing specimens with the
geometry shown in Figure 14.13.
Different sets of the LSPR specimens were produced with various material
combinations as listed in Table 14.3. The preparation and testing of all LSPR
specimens were conducted by various contractors for the US Automotive Material
Partnership (USAMP).
Load-controlled cyclic tests with a load ratio of R ¼ 0:1 were conducted to deter-
mine the fatigue strength. The results are shown in Figure 14.14.