
Page 378 - Handbook of Materials Failure Analysis
P. 378
376 CHAPTER 14 Fatigue failure analysis of welded structures
4500
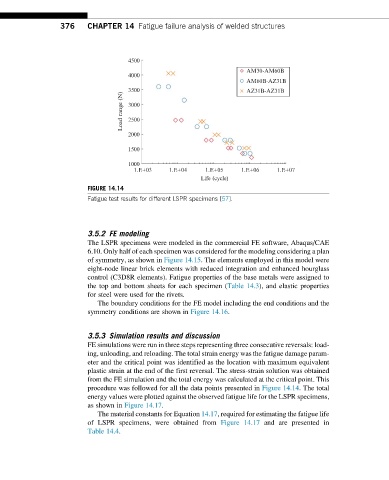
AM30-AM60B
4000
AM60B-AZ31B
3500 AZ31B-AZ31B
Load range (N) 3000
2500
2000
1500
1000
1.E+03 1.E+04 1.E+05 1.E+06 1.E+07
Life (cycle)
FIGURE 14.14
Fatigue test results for different LSPR specimens [57].
3.5.2 FE modeling
The LSPR specimens were modeled in the commercial FE software, Abaqus/CAE
6.10. Only half of each specimen was considered for the modeling considering a plan
of symmetry, as shown in Figure 14.15. The elements employed in this model were
eight-node linear brick elements with reduced integration and enhanced hourglass
control (C3D8R elements). Fatigue properties of the base metals were assigned to
the top and bottom sheets for each specimen (Table 14.3), and elastic properties
for steel were used for the rivets.
The boundary conditions for the FE model including the end conditions and the
symmetry conditions are shown in Figure 14.16.
3.5.3 Simulation results and discussion
FE simulations were run in three steps representing three consecutive reversals: load-
ing, unloading, and reloading. The total strain energy was the fatigue damage param-
eter and the critical point was identified as the location with maximum equivalent
plastic strain at the end of the first reversal. The stress-strain solution was obtained
from the FE simulation and the total energy was calculated at the critical point. This
procedure was followed for all the data points presented in Figure 14.14. The total
energy values were plotted against the observed fatigue life for the LSPR specimens,
as shown in Figure 14.17.
The material constants for Equation 14.17, required for estimating the fatigue life
of LSPR specimens, were obtained from Figure 14.17 and are presented in
Table 14.4.