
Page 381 - Handbook of Materials Failure Analysis
P. 381
3 Case Study: Fatigue Life Assessment of an Automotive Demo-Structure 379
10
y = 482.991 × –0.492
Total energy (MJ/m 3 ) 1
2
R = 0.936
0.1
1.E+03 1.E+04 1.E+05 1.E+06 1.E+07
(a) Life (cycle)
10
y = 430.967 × –0.433
Total energy (MJ/m 3 ) 1
2
R = 0.943
0.1
1.E+03 1.E+04 1.E+05 1.E+06 1.E+07
(b) Life (cycle)
100 y = 802.948 × –0.511
Total energy (MJ/m 3 ) 10 1 R = 0.899
2
0.1
1.E+03 1.E+04 1.E+05 1.E+06
(c) Life (cycle)
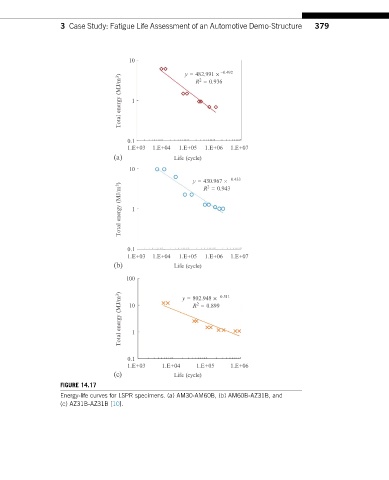
FIGURE 14.17
Energy-life curves for LSPR specimens. (a) AM30-AM60B, (b) AM60B-AZ31B, and
(c) AZ31B-AZ31B [10].