Page 368 - Handbook of Materials Failure Analysis
P. 368

366    CHAPTER 14 Fatigue failure analysis of welded structures


                               s                                   s
                                                   1                          1
                                                           3
                                                                                  3
                                                                        S 2
                                                      W  e+                        W p
                                                                            S 1
                                   2                  e               2                  e  –p
                                O                                  O

                           (a)                                (b)
                         FIGURE 14.5
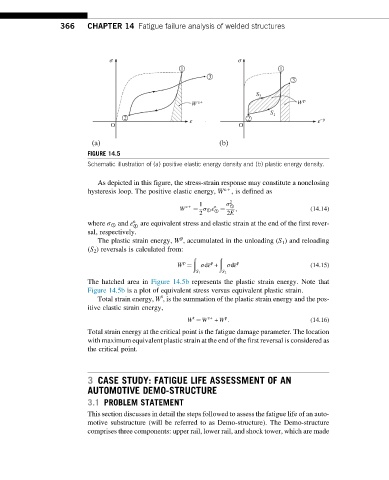
                         Schematic illustration of (a) positive elastic energy density and (b) plastic energy density.

                            As depicted in this figure, the stress-strain response may constitute a nonclosing
                         hysteresis loop. The positive elastic energy, W e+  , is defined as
                                                        1       σ 2 ①
                                                            e
                                                   W e+  ¼ σ ① ε ¼  ;                  (14.14)
                                                            ①
                                                        2       2E
                                      e
                         where σ ① and ε are equivalent stress and elastic strain at the end of the first rever-
                                      ①
                         sal, respectively.
                                                   p
                            The plastic strain energy, W , accumulated in the unloading (S 1 ) and reloading
                         (S 2 ) reversals is calculated from:
                                                       ð      ð
                                                    p      p       p
                                                  W ¼    σdε +  σdε                    (14.15)
                                                       S 1     S 2
                         The hatched area in Figure 14.5b represents the plastic strain energy. Note that
                         Figure 14.5b is a plot of equivalent stress versus equivalent plastic strain.
                                              t
                            Total strain energy, W , is the summation of the plastic strain energy and the pos-
                         itive elastic strain energy,
                                                               p
                                                       t
                                                     W ¼ W e+  + W :                   (14.16)
                         Total strain energy at the critical point is the fatigue damage parameter. The location
                         with maximum equivalent plastic strain at the end of the first reversal is considered as
                         the critical point.


                         3 CASE STUDY: FATIGUE LIFE ASSESSMENT OF AN
                         AUTOMOTIVE DEMO-STRUCTURE
                         3.1 PROBLEM STATEMENT
                         This section discusses in detail the steps followed to assess the fatigue life of an auto-
                         motive substructure (will be referred to as Demo-structure). The Demo-structure
                         comprises three components: upper rail, lower rail, and shock tower, which are made
   363   364   365   366   367   368   369   370   371   372   373