
Page 451 - Handbook of Materials Failure Analysis
P. 451
3 Results 449
Abundance
6
1.3e+07
5
1.25e+07
1.2e+07
1.15e+07
1.1e+07
1.05e+07
1e+07
9,500,000
9,000,000
8,500,000
8,000,000
7,500,000
7,000,000
6,500,000
6,000,000
2
5,500,000
5,000,000
4 7 10
4,500,000
1
4,000,000 3
3,500,000
3,000,000
8
2,500,000
9 13
2,000,000
11
1,500,000
1,000,000 14
500,000
0
10.00 15.00 20.00 25.00 30.00 35.00 40.00
(a) Time (min)
Abundance
6
1,100,000
1,000,000
5
900,000
800,000
700,000
600,000 15
500,000
12
400,000
8 13
300,000
1
2 9
200,000 3 4
7
100,000 14
0
10.00 15.00 20.00 25.00 30.00 35.00 40.00
(b) Time (min)
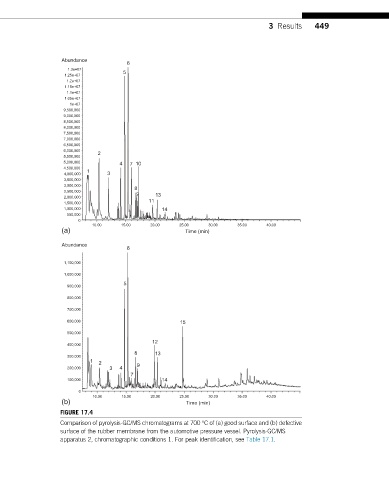
FIGURE 17.4
Comparison of pyrolysis-GC/MS chromatograms at 700 °C of (a) good surface and (b) defective
surface of the rubber membrane from the automotive pressure vessel. Pyrolysis-GC/MS
apparatus 2, chromatographic conditions 1. For peak identification, see Table 17.1.