
Page 23 - Handbook of Plastics Technologies
P. 23
INTRODUCTION TO POLYMERS AND PLASTICS
INTRODUCTION TO POLYMERS AND PLASTICS 1.9
tors such as test temperature and rates. This can be especially important to the designer
when the product is used or tested at temperatures near the glass transition temperature,
where dramatic changes in properties occur as depicted in Fig. 1.5. The time-dependent
behavior of these materials is discussed below.
1.4.1 Viscoelasticity
Polymer properties exhibit time-dependent behavior, meaning that the measured proper-
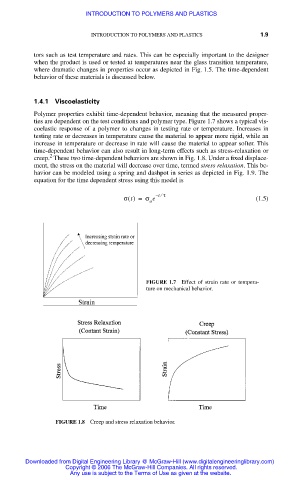
ties are dependent on the test conditions and polymer type. Figure 1.7 shows a typical vis-
coelastic response of a polymer to changes in testing rate or temperature. Increases in
testing rate or decreases in temperature cause the material to appear more rigid, while an
increase in temperature or decrease in rate will cause the material to appear softer. This
time-dependent behavior can also result in long-term effects such as stress-relaxation or
2
creep. These two time-dependent behaviors are shown in Fig. 1.8. Under a fixed displace-
ment, the stress on the material will decrease over time, termed stress relaxation. This be-
havior can be modeled using a spring and dashpot in series as depicted in Fig. 1.9. The
equation for the time dependent stress using this model is
t – ⁄ τ
σ t() = σ e (1.5)
o
FIGURE 1.7 Effect of strain rate or tempera-
ture on mechanical behavior.
FIGURE 1.8 Creep and stress relaxation behavior.
Downloaded from Digital Engineering Library @ McGraw-Hill (www.digitalengineeringlibrary.com)
Copyright © 2006 The McGraw-Hill Companies. All rights reserved.
Any use is subject to the Terms of Use as given at the website.