
Page 27 - Handbook of Plastics Technologies
P. 27
INTRODUCTION TO POLYMERS AND PLASTICS
INTRODUCTION TO POLYMERS AND PLASTICS 1.13
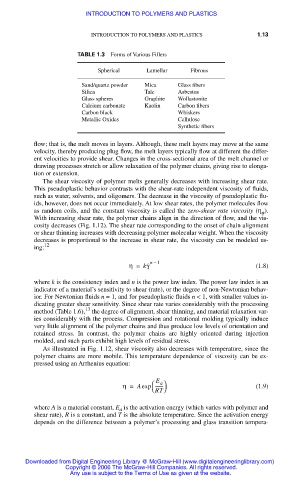
TABLE 1.3 Forms of Various Fillers
Spherical Lamellar Fibrous
Sand/quartz powder Mica Glass fibers
Silica Talc Asbestos
Glass spheres Graphite Wollastonite
Calcium carbonate Kaolin Carbon fibers
Carbon black Whiskers
Metallic Oxides Cellulose
Synthetic fibers
flow; that is, the melt moves in layers. Although, these melt layers may move at the same
velocity, thereby producing plug flow, the melt layers typically flow at different the differ-
ent velocities to provide shear. Changes in the cross-sectional area of the melt channel or
drawing processes stretch or allow relaxation of the polymer chains, giving rise to elonga-
tion or extension.
The shear viscosity of polymer melts generally decreases with increasing shear rate.
This pseudoplastic behavior contrasts with the shear-rate independent viscosity of fluids,
such as water, solvents, and oligomers. The decrease in the viscosity of pseudoplastic flu-
ids, however, does not occur immediately. At low shear rates, the polymer molecules flow
as random coils, and the constant viscosity is called the zero-shear rate viscosity (η ).
o
With increasing shear rate, the polymer chains align in the direction of flow, and the vis-
cosity decreases (Fig. 1.12). The shear rate corresponding to the onset of chain alignment
or shear thinning increases with decreasing polymer molecular weight. When the viscosity
decreases is proportional to the increase in shear rate, the viscosity can be modeled us-
12
ing:
n 1
–
η = kγ ˙ (1.8)
where k is the consistency index and n is the power law index. The power law index is an
indicator of a material’s sensitivity to shear (rate), or the degree of non-Newtonian behav-
ior. For Newtonian fluids n = 1, and for pseudoplastic fluids n < 1, with smaller values in-
dicating greater shear sensitivity. Since shear rate varies considerably with the processing
13
method (Table 1.6), the degree of alignment, shear thinning, and material relaxation var-
ies considerably with the process. Compression and rotational molding typically induce
very little alignment of the polymer chains and thus produce low levels of orientation and
retained stress. In contrast, the polymer chains are highly oriented during injection
molded, and such parts exhibit high levels of residual stress.
As illustrated in Fig. 1.12, shear viscosity also decreases with temperature, since the
polymer chains are more mobile. This temperature dependence of viscosity can be ex-
pressed using an Arrhenius equation:
⎛ E a ⎞
η = Aexp ------- (1.9)
⎝ RT ⎠
where A is a material constant, E is the activation energy (which varies with polymer and
a
shear rate), R is a constant, and T is the absolute temperature. Since the activation energy
depends on the difference between a polymer’s processing and glass transition tempera-
Downloaded from Digital Engineering Library @ McGraw-Hill (www.digitalengineeringlibrary.com)
Copyright © 2006 The McGraw-Hill Companies. All rights reserved.
Any use is subject to the Terms of Use as given at the website.