
Page 25 - Handbook of Plastics Technologies
P. 25
INTRODUCTION TO POLYMERS AND PLASTICS
INTRODUCTION TO POLYMERS AND PLASTICS 1.11
failure include general purpose polystyrene and acrylics. Failure typically starts at a defect
where stresses are concentrated. Once a crack is formed, it will grow as a result of stress
concentrations at the crack tip. Many amorphous polymers will also exhibit what are
called crazes. Crazes appear to look like cracks, but they are load bearing, with fibrils of
material bridging the two surfaces as shown in Fig. 1.10. Crazing is a form of yielding
and, when present, can enhance the toughness of a material.
FIGURE 1.10 Cracks and crazes.
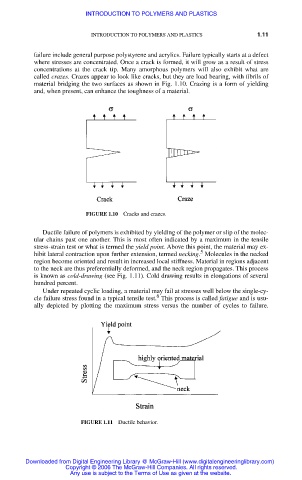
Ductile failure of polymers is exhibited by yielding of the polymer or slip of the molec-
ular chains past one another. This is most often indicated by a maximum in the tensile
stress-strain test or what is termed the yield point. Above this point, the material may ex-
5
hibit lateral contraction upon further extension, termed necking. Molecules in the necked
region become oriented and result in increased local stiffness. Material in regions adjacent
to the neck are thus preferentially deformed, and the neck region propagates. This process
is known as cold-drawing (see Fig. 1.11). Cold drawing results in elongations of several
hundred percent.
Under repeated cyclic loading, a material may fail at stresses well below the single-cy-
6
cle failure stress found in a typical tensile test. This process is called fatigue and is usu-
ally depicted by plotting the maximum stress versus the number of cycles to failure.
FIGURE 1.11 Ductile behavior.
Downloaded from Digital Engineering Library @ McGraw-Hill (www.digitalengineeringlibrary.com)
Copyright © 2006 The McGraw-Hill Companies. All rights reserved.
Any use is subject to the Terms of Use as given at the website.