
Page 193 - Handbook of Properties of Textile and Technical Fibres
P. 193
170 8 Bmf - I Handbook of Properties of Textile and Technical Fibres
Raman shift of the ν N-H band / cm –1 6 4 2 Bmdw - III IV III I
II
Bmd - II
Neph - IV
0
0 5 10 15 20
Strain / %
Figure 5.17 Plots of the nNeH wave number for different fibers strained up to the fracture in
dry environment (two to four fibers were tested for each Type, I (crossed dot), II (square), III
(triangle), and IV (cross); Type I, II, and III are extracted from B. mori cocoons, degummed or
not, Type IV are Nephila madagascariensis fiber. The solid lines show the mean behavior of
each type (see Fig. 5.3 for comparison).
After Colomban P, Dinh HM: Origin of the variability of the mechanical properties of silk
fibres: II, the nanomechanics of single silkworm and spider fibres, J Raman Spectrosc
43:1035e1041, 2012.
(Colomban et al., 2006; Colomban, 2013): changes takes place at the same strain
values. This confirms that the mechanical behavior is driven by the polymer structure.
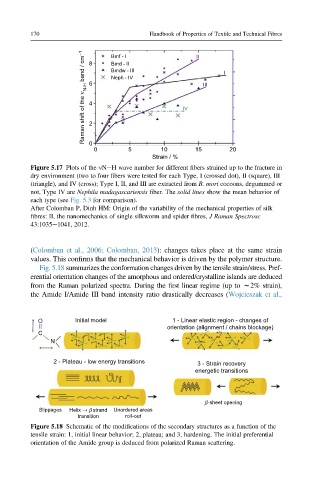
Fig. 5.18 summarizes the conformation changes driven by the tensile strain/stress. Pref-
erential orientation changes of the amorphous and ordered/crystalline islands are deduced
from the Raman polarized spectra. During the first linear regime (up to w2% strain),
the Amide I/Amide III band intensity ratio drastically decreases (Wojcieszak et al.,
O Initial model 1 - Linear elastic region - changes of
orientation (alignment / chains blockage)
C
N
2 - Plateau - low energy transitions 3 - Strain recovery
energetic transitions
β -sheet opening
Slippages Helix → β strand Unordered areas
transition roll-out
Figure 5.18 Schematic of the modifications of the secondary structures as a function of the
tensile strain: 1, initial linear behavior; 2, plateau; and 3, hardening. The initial preferential
orientation of the Amide group is deduced from polarized Raman scattering.