
Page 231 - Handbook of Properties of Textile and Technical Fibres
P. 231
206 Handbook of Properties of Textile and Technical Fibres
1.20 0.12
1.00 0.10
Kevlar
0.80 Spider silk 0.08
Dynamic moduli R(ω) 0.60 0.06 Damping l (ω)
0.04
0.40
0.20 Spider silk 0.02
Kevlar
0.00 0.00
–7.00 –5.00 –3.00 –1.00 1.00 3.00
Frequency ω (Hz) in logarithmic scale
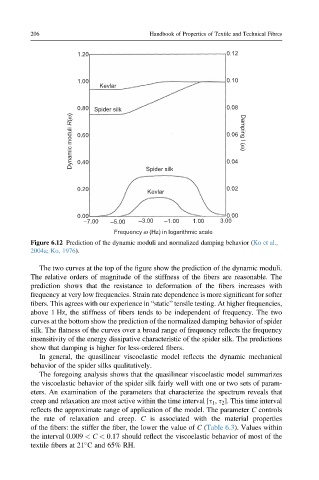
Figure 6.12 Prediction of the dynamic moduli and normalized damping behavior (Ko et al.,
2004a; Ko, 1976).
The two curves at the top of the figure show the prediction of the dynamic moduli.
The relative orders of magnitude of the stiffness of the fibers are reasonable. The
prediction shows that the resistance to deformation of the fibers increases with
frequency at very low frequencies. Strain rate dependence is more significant for softer
fibers. This agrees with our experience in “static” tensile testing. At higher frequencies,
above 1 Hz, the stiffness of fibers tends to be independent of frequency. The two
curves at the bottom show the prediction of the normalized damping behavior of spider
silk. The flatness of the curves over a broad range of frequency reflects the frequency
insensitivity of the energy dissipative characteristic of the spider silk. The predictions
show that damping is higher for less-ordered fibers.
In general, the quasilinear viscoelastic model reflects the dynamic mechanical
behavior of the spider silks qualitatively.
The foregoing analysis shows that the quasilinear viscoelastic model summarizes
the viscoelastic behavior of the spider silk fairly well with one or two sets of param-
eters. An examination of the parameters that characterize the spectrum reveals that
creep and relaxation are most active within the time interval [s 1 , s 2 ]. This time interval
reflects the approximate range of application of the model. The parameter C controls
the rate of relaxation and creep. C is associated with the material properties
of the fibers: the stiffer the fiber, the lower the value of C (Table 6.3). Values within
the interval 0.009 < C < 0.17 should reflect the viscoelastic behavior of most of the
textile fibers at 21 C and 65% RH.