Page 494 - Handbook of Properties of Textile and Technical Fibres
P. 494
Tensile failure of polyester fibers 467
In the Harland model (Harland et al., 1975), the idea of a three-phase structure of
the polymer composed of microfibrils mutually interconnected by tie chains, which
are located in the amorphous matrix, is used. This structure is replaced by networks
that constitute binding points from crystallites mutually connected by tie chain links.
The model takes into account the partial destruction of the crystalline phase associated
with chain pull out. However, this model contains many experimentally undetermin-
able parameters.
Nagamura et al. (1975) started from the three-phase fiber model composed of two
continuous phases (amorphous and crystalline) connected by tie chains of different
lengths. These chains are gradually deformed up to the break. The macroscopic stress
of a deformed polymer is calculated by adding the stresses transferred by the amor-
phous phase and those transferred by various tie chains. This model includes experi-
mentally undeterminable parameters such as the distribution of tie chain lengths.
A model, which accounts for the deformation-induced evolution of the structure of
amorphous and crystalline phase, is published in the work by Oshmyan et al. (2004).
Review of modeling approaches for oriented semicrystalline polymers is presented
by Breese and Beaucage (2004).
13.4.1.4 Multiphase models
Unlike structural models here it is assumed that all structural phases of the fiber are
continuous. Each phase is characterized by its mechanical characteristics, the volume
fraction, and a degree of orientation. For a simple two-phase structure (amorphous and
crystalline) of semicrystalline polymers there are two basic arrangements (Nielsen,
1975). In the serial arrangement both phases have the same stress and deformation
is changed abruptly (Reuss average). In the parallel arrangement both phases have
the same deformation and stress is changed by jumps (Voigt average).
The distribution of stress or strain is somewhere between these two extremes. To
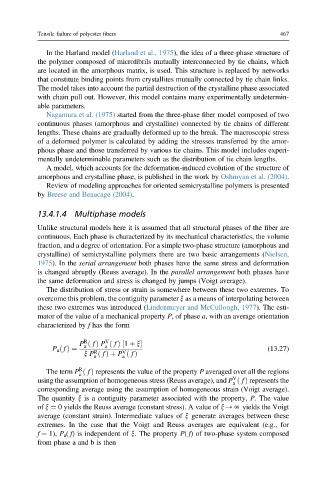
overcome this problem, the contiguity parameter x as a means of interpolating between
these two extremes was introduced (Lindenmeyer and McCullough, 1977). The esti-
mator of the value of a mechanical property P, of phase a, with an average orientation
characterized by f has the form
R V
P ð f Þ P ð f Þ½1 þ x
a
a
P a ð f Þ¼ (13.27)
V
R
x P ð f Þþ P ð f Þ
a
a
R
The term P ð f Þ represents the value of the property P averaged over all the regions
a
V
using the assumption of homogeneous stress (Reuss average), and P ð f Þ represents the
a
corresponding average using the assumption of homogeneous strain (Voigt average).
The quantity x is a contiguity parameter associated with the property, P. The value
of x ¼ 0 yields the Reuss average (constant stress). A value of x/N yields the Voigt
average (constant strain). Intermediate values of x generate averages between these
extremes. In the case that the Voigt and Reuss averages are equivalent (e.g., for
f ¼ 1), P a ( f) is independent of x. The property P( f) of two-phase system composed
from phase a and b is then

