
Page 507 - Handbook of Properties of Textile and Technical Fibres
P. 507
480 Handbook of Properties of Textile and Technical Fibres
phase through three different analog representations leading to the classical upper and
lower bounds (Ahzi et al., 2003; Makradi et al., 2005).
13.4.3.2 Stress-strain curve characteristics
The shape of the stress-strain curve of fibers is generally dependent on their thermal
and mechanical history, i.e., conditions of spinning, drawing, and heat setting. The
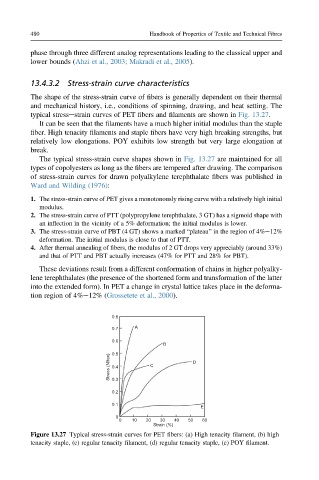
typical stressestrain curves of PET fibers and filaments are shown in Fig. 13.27.
It can be seen that the filaments have a much higher initial modulus than the staple
fiber. High tenacity filaments and staple fibers have very high breaking strengths, but
relatively low elongations. POY exhibits low strength but very large elongation at
break.
The typical stress-strain curve shapes shown in Fig. 13.27 are maintained for all
types of copolyesters as long as the fibers are tempered after drawing. The comparison
of stress-strain curves for drawn polyalkylene terephthalate fibers was published in
Ward and Wilding (1976):
1. The stress-strain curve of PET gives a monotonously rising curve with a relatively high initial
modulus.
2. The stress-strain curve of PTT (polypropylene terephthalate, 3 GT) has a sigmoid shape with
an inflection in the vicinity of a 5% deformation; the initial modulus is lower.
3. The stress-strain curve of PBT (4 GT) shows a marked “plateau” in the region of 4%e12%
deformation. The initial modulus is close to that of PTT.
4. After thermal annealing of fibers, the modulus of 2 GT drops very appreciably (around 33%)
and that of PTT and PBT actually increases (47% for PTT and 28% for PBT).
These deviations result from a different conformation of chains in higher polyalky-
lene terephthalates (the presence of the shortened form and transformation of the latter
into the extended form). In PET a change in crystal lattice takes place in the deforma-
tion region of 4%e12% (Grossetete et al., 2000).
0.8
0.7 A
0.6
B
0.5
Stress (N/tex) 0.4 C D
0.3
0.2
0.1
E
0
0 10 20 30 40 50 60
Strain (%)
Figure 13.27 Typical stress-strain curves for PET fibers: (a) High tenacity filament, (b) high
tenacity staple, (c) regular tenacity filament, (d) regular tenacity staple, (e) POY filament.