
Page 502 - Handbook of Properties of Textile and Technical Fibres
P. 502
Tensile failure of polyester fibers 475
In practical applications the assumption of constant volume during deformation is
used and true stress is expressed in the form
s t ¼ sð1 þ εÞ (13.44)
It is interesting that for linear true stress/true strain dependence s t ¼ Eε t for an
incompressible material, the engineering stress strain diagram is a convex increasing
curve:
E lnð1 þ εÞ
s ¼ (13.45)
1 þ ε
where E is the initial modulus for true stress/strain dependence, which is equal to the
initial modulus of the engineering stress-strain curve because the value of derivative
2
2
0
[ln(x)/x] ¼ 1/(x þ 1) log(x þ 1)/(x þ 1) for x approaching 1 is equal to 1. In the
case of a polymer with a constant Poisson’s ratio during deformation, Eq. (13.45) is
replaced by form
2
s ¼ Eð1 nεÞ lnð1 þ εÞ (13.46)
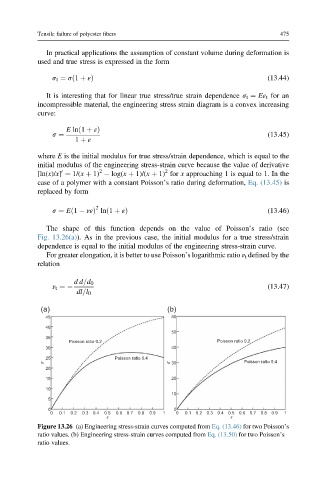
The shape of this function depends on the value of Poisson’s ratio (see
Fig. 13.26(a)). As in the previous case, the initial modulus for a true stress/strain
dependence is equal to the initial modulus of the engineering stress-strain curve.
For greater elongation, it is better to use Poisson’s logarithmic ratio n t defined by the
relation
dd=d 0
n t ¼ (13.47)
dl=l 0
(a) (b)
45 60
40
50
35
Poisson ratio 0.2 Poisson ratio 0.2
30 40
25 Poisson ratio 0.4
σ σ 30 Poisson ratio 0.4
20
15 20
10
10
5
0 0
0 0.1 0.2 0.3 0.4 0.5 0.6 0.7 0.8 0.9 1 0 0.1 0.2 0.3 0.4 0.5 0.6 0.7 0.8 0.9 1
ε ε
Figure 13.26 (a) Engineering stress-strain curves computed from Eq. (13.46) for two Poisson’s
ratio values. (b) Engineering stress-strain curves computed from Eq. (13.50) for two Poisson’s
ratio values.