
Page 500 - Handbook of Properties of Textile and Technical Fibres
P. 500
Tensile failure of polyester fibers 473
The photodegradation of PET is predominantly due to chain scission in the ester
group. Carbon dioxide and carbon monoxide may be liberated. The carboxyl end-
groups are formed during PET photodegradation (Allen et al., 1994). These carboxyl
end-groups act as catalysts to promote further degradation (Bikiaris and Karayannidis,
1999). An alternative chain scission process is indicated by the fact that vinyl groups
are formed in the degrading PET.
13.4.3 Analysis of stress-strain curves
Stress-strain curves of fibers are determined by the use of dynamometers, which are
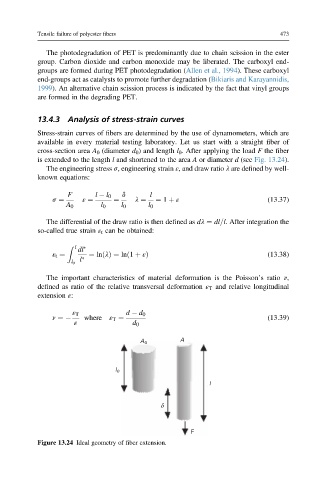
available in every material testing laboratory. Let us start with a straight fiber of
cross-section area A 0 (diameter d 0 ) and length l 0 . After applying the load F the fiber
is extended to the length l and shortened to the area A or diameter d (see Fig. 13.24).
The engineering stress s, engineering strain ε, and draw ratio l are defined by well-
known equations:
F l l 0 d l
s ¼ ε ¼ ¼ l ¼ ¼ 1 þ ε (13.37)
A 0 l 0 l 0 l 0
The differential of the draw ratio is then defined as dl ¼ dl=l. After integration the
so-called true strain ε t can be obtained:
dl
Z l
ε t ¼ ¼ lnðlÞ¼ lnð1 þ εÞ (13.38)
l
l 0
The important characteristics of material deformation is the Poisson’s ratio n,
defined as ratio of the relative transversal deformation ε T and relative longitudinal
extension ε:
ε T d d 0
n ¼ where ε T ¼ (13.39)
ε d 0
A
A o
l o
l
δ
F
Figure 13.24 Ideal geometry of fiber extension.