Page 512 - Handbook of Properties of Textile and Technical Fibres
P. 512
Tensile failure of polyester fibers                                485

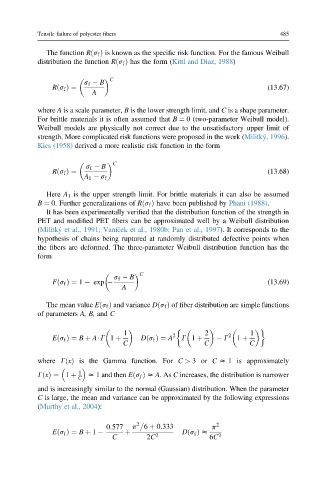
              The function Rðs f Þ is known as the specific risk function. For the famous Weibull
           distribution the function Rðs f Þ has the form (Kittl and Diaz, 1988)

                               C
                        s f   B
               Rðs f Þ¼                                                  (13.67)
                          A
           where A is a scale parameter, B is the lower strength limit, and C is a shape parameter.
           For brittle materials it is often assumed that B ¼ 0 (two-parameter Weibull model).
           Weibull models are physically not correct due to the unsatisfactory upper limit of
           strength. More complicated risk functions were proposed in the work (Militký, 1996).
           Kies (1958) derived a more realistic risk function in the form


                                C
                        s f   B
               Rðs f Þ¼                                                  (13.68)
                        A 1   s f
              Here A 1 is the upper strength limit. For brittle materials it can also be assumed
           B ¼ 0. Further generalizations of Rðs f Þ have been published by Phani (1988).
              It has been experimentally verified that the distribution function of the strength in
           PET and modified PET fibers can be approximated well by a Weibull distribution
           (Militký et al., 1991; Vaní  cek et al., 1980b; Pan et al., 1997). It corresponds to the
           hypothesis of chains being ruptured at randomly distributed defective points when
           the fibers are deformed. The three-parameter Weibull distribution function has the
           form

                                       C
                                s f   B

               Fðs f Þ¼ 1   exp                                          (13.69)
                                  A
              The mean value Eðs f Þ and variance Dðs f Þ of fiber distribution are simple functions
           of parameters A, B, and C


                                  1             2       2      2     1
               Eðs f Þ¼ B þ A$G 1 þ    Dðs f Þ¼ A  G 1 þ     G   1 þ
                                  C                     C           C
           where GðxÞ is the Gamma function. For C > 3or C z 1 is approximately

                      1
           GðxÞ¼ 1 þ     z 1 and then Eðs f Þ z A.As C increases, the distribution is narrower
                      C
           and is increasingly similar to the normal (Gaussian) distribution. When the parameter
           C is large, the mean and variance can be approximated by the following expressions
           (Murthy et al., 2004):


                              0:577  p 2    6 þ 0:333     p 2
               Eðs f Þ¼ B þ 1      þ       2      Dðs f Þ z  2
                               C         2C               6C

